ocudu-gpu-channel
GPU channel emulator · 5G NR slot cadence
A real-time, in-the-loop wireless channel emulator that sits between live SDR stacks (srsRAN gNB/UE, OCUDU runtime) over ZMQ and applies CUDA channel models — TR 38.901 §7.7.2 TDL profiles, Jakes Doppler, Rician LOS — inside the 5G NR slot deadline.
(1 ms at 15 kHz)
(TDL-A 23-tap, 16-edge fan-in)
(ctest gate)
This is the deep technical reference behind the README. Seven parts cover broker architecture, topology + YAML model, per-slot signal alignment, GPU compute, signal memory, multi-stream concurrency, runtime mutability, observability, validation, and the measured performance envelope.
Part I — Concepts
What the system is, the vocabulary, and the three-layer split.
1. Overview
ocudu-gpu-channel is a real-time, in-the-loop channel emulator that sits between live
SDR stacks (OCUDU runtime, srsRAN gNB/UE) over ZMQ and applies CUDA channel models inside
the 5G NR slot deadline. This doc is the implementation reference — it assumes you
have already read the README for positioning and
quick-start.
Single-antenna radios and multi-port radios. Parts I–VI describe the engine on a graph of single-antenna radios, where one radio is one ZMQ endpoint pair and one edge is one scalar channel. That is the whole system for a 1×1 deployment and it is where a first reading should start. Part VII adds the overlay for radios with several antenna ports: several ports are grouped into one radio node, a link between two such radios carries an Nt × Nr matrix, and every coefficient of that matrix belongs to one sample epoch. There is no second engine underneath — a multi-port link expands into ordinary per-edge lanes, and a single-port topology is the Nt = Nr = 1 case of the same path, byte for byte.
Slot length and SCS. The slot deadline depends on the subcarrier
spacing: 1 ms at 15 kHz SCS, 500 µs at 30 kHz SCS (the
bench default and the §20 measurement frame), and 250 µs at
60 kHz SCS. Where this document says "1 ms slot" it refers to the 15 kHz
case; the perf section and latency gate use the 30 kHz / 500 µs target. The
bench is invoked with --scs-khz N and the green/yellow/red gate scales to
the chosen N.
Reading order. The doc is grouped into seven parts, in the order a new reader is likely to want them. Part I (§1–§3) is the system shape: overview, vocabulary, and the three-layer split — start here (Diagram F). Part II (§4–§6) is everything the user writes in YAML — the topology graph, the channel chain, and the TR 38.901 §7.7.2 physics that chain encodes (Diagrams G, V, P, Q, R). Part III (§7–§13) walks the per-slot data path in execution order: end-to-end serve flow (Diagram MF) → broker loop (Diagram K) → alignment + time discipline (Diagrams H, L, M) → staged buffer (Diagram J) → per-edge channel kernel with subsections 11.0–11.4 (Diagrams S, SG, X, Y, Z) → superposition → per-sample RF chain (Diagram E). Part IV (§14–§16) is the supporting infrastructure — CPU/CUDA backend pair (the parity contract), signal memory (Diagram D), multi-stream concurrency (Diagram I). Part V (§17) is the runtime control plane that mutates per-edge channel parameters at slot boundaries without restarting the broker. Part VI (§18–§21) is engineering: validation (Diagram TA), profiling instrumentation (Diagram N), measured performance (Diagrams O, T, U, W), and the latency-gate verdict. Part VII (§22–§25) is the multi-port radio overlay: radio nodes and the matrix index (§22), the one-sample-epoch discipline and why the broker must not outrun a lock-step radio (§23), the three ways to declare H (§24), and the live evidence with its claim boundary (§25). Part VIII (§26) is forward-looking scope and planned work.
Reader paths. Cover-to-cover works, but most readers don't need it. Three shortcuts that hit most use cases: (1) Fast tour — Part I + the end-to-end serve flow (§7) + the perf-headline (§20.0) gives the system shape, what one slot does, and how fast it runs in about ten minutes. (2) Writing topology YAML — skip to Part II (§4–§6) for the configuration surface, then jump to §21.1 for the latency-gate verdict that tells you when your topology is too heavy. (3) Driving the control plane — §17 is self-contained; if you only need the wire protocol, start at §17.2 and follow its sub-anchors as you go. Part V can be skipped entirely if the broker will run from static YAML; nothing else in the doc forward-references it.
2. Key terms — quick reference
The diagrams below name buffers, indices, and struct fields directly from
src/cuda_backend.cu and src/broker.cpp. Skim this table before
reading; later sections use these names without re-introducing them.
Topology
| Term | Meaning |
|---|---|
| node | a device in the graph (a gNB or a UE); the broker serves one RX signal per node, per slot. On a multi-port radio the node is the radio and the endpoint pair is a port — see §22 |
| port | one ZMQ endpoint pair, its TX ring and its puller. A single-antenna radio has exactly one, and then "port" and "node" name the same thing |
| radio node | one or more ports that are one radio: they share a sample epoch, a throttle, a cursor set and one channel call. Declared under radio_nodes:, where writing order is the matrix index (§22) |
| physical link | the directed pair of radio nodes, and the owner of one channel realization: one seed, one absolute-time origin, one correlation factor (§24) |
| lane | one (rx_port, tx_port) coefficient of a physical link, and an ordinary edge to the engine. A physical link expands to Nt × Nr lanes |
| Nt / Nr | transmit / receive port counts of a physical link's two radios, taken from the node declarations rather than from any matrix block |
| edge | a directed channel from one node to another, configured under links: in the YAML topology with a named model. This doc says "edge" in prose (a node's "incoming edges" are the edges pointing at it); the YAML key links: and the runtime identifiers link_id / link_key keep the word "link" because they are API names |
| incoming edges | for destination node d, the subset of links where link.to == d. Resolved once per server thread at broker startup (src/broker.cpp); this list is the index space for cursors (§9), staged slots (§10), per-edge stage_link() calls (§11), and the kernel's per-thread edge loop (§12) |
| model | a chain of channel steps (tdl, path_loss, phase, CFO, AWGN) applied per-edge under models: in the YAML |
| rx_model | an optional second model applied once to the summed RX of a node — typically a thermal-noise floor |
| gNB / UE | 5G base station (gNodeB) / user equipment; both are just "nodes" to the emulator |
| OCUDU | the Split-8 ZMQ SDR runtime that exchanges IQ slots with the broker over tcp:// |
Signals and indices
| Term | Meaning |
|---|---|
| IQ sample | one complex baseband sample, an (i, q) pair of float32s |
| slot / batch | one 1 ms IQ exchange — 23 040 samples = 23.04 MS/s × 1 ms in the canonical topology (any other sample rate works; batch is derived from sample_rate_hz × slot_duration) |
| count | per-batch sample count = 23 040 in the canonical topology (the kernel parameter named count) |
| N · link_count | number of incoming edges into a destination node; the per-thread loop bound in superpose_kernel |
| k | per-edge loop index inside superpose_kernel (0 … N − 1) |
| idx | per-thread / per-sample index (0 … count − 1) — every diagram's idx is this |
| sequence number | monotonic uint64_t tag on every sample written into a source's IQ ring; used by the broker for cursor co-init and common-window reads |
Buffers (per RX node — CudaSuperposeState)
| Name | What it holds |
|---|---|
| host_staged · device_staged | The "staged" array. Every incoming edge's input batch packed back-to-back in one contiguous block: edge k's sample idx lives at staged[k·count + idx]. The broker writes per-edge batches into pinned host_staged, then a single H2D copies the whole concatenation to device_staged for the kernel to read. Total size: N × 23 040 IQ samples. |
| host_output · device_output | the node's summed RX signal; the kernel writes device_output, a single D2H copies to pinned host_output, the broker serves it over ZMQ |
| host_steps · device_steps | flat GpuStep array — every edge's chain concatenated head-to-tail |
| host_step_meta · device_step_meta | 2N × int: the first N entries are each edge's offset into device_steps; the next N are each edge's chain length |
| device_rx_steps | optional second chain (the rx_model) — consumed by an in-place apply_steps_kernel pass after superpose_kernel |
Per-edge state lives in CudaLinkSlot (just the
LinkModelState — the chain steps, Philox seed, and
delay_line ring). The bench-only per-edge scratch buffers
(host_input · device_input · device_steps · host_output ·
device_output) and their lazy-allocation path were unified away with
the old process_into API; the broker's superposition serve
carries all required per-call buffers in CudaSuperposeState.
Chain step (GpuStep)
| Field | Used by | Meaning |
|---|---|---|
| step.type | all branches | Scale | Phase | AddNoise — selects which branch runs in the per-sample chain (the tdl chain step is configured but handled before this kernel runs: by apply_channel_kernel on device by default, or by host stage_link() on fallback) |
| step.a | all | scalar: amplitude factor (Scale — used for path_loss and as the no-op pass-through for a chain-leading tdl), base phase (Phase), noise amplitude (AddNoise) |
| step.b | Phase | phase increment per sample, in radians; b = 2π·fcfo/fs for CFO; b = 0 for a static phase rotation |
| step.seed · step.counter | AddNoise | Philox4_32_10 state — the RNG is keyed on (seed, counter + idx); counter advances by count every call |
Functions, kernels, runtime
| Name | What it is |
|---|---|
| apply_chain() | __device__ function that walks one chain on (i, q) in registers; called inside both kernels |
| apply_steps_kernel | single-edge kernel; also runs in-place as the rx_model pass after superpose_kernel |
| superpose_kernel | multi-edge superposition kernel — one thread per output sample, walks every edge, sums into dst[idx] |
| stage_link() | host-side fallback helper that runs the chain-leading tdl step (multi-tap convolution via apply_tdl_step{_fading} in delay.h) before the H2D copy. The production path is apply_channel_kernel on device (§11 Diagram S); stage_link() runs only when the per-node dispatch gate doesn't fire (mixed-edge or non-tdl-leading topologies), and as the CPU-backend reference |
| apply_channel_kernel | device-side per-edge channel kernel in src/device_channel.cu — runs the multi-tap convolution + Jakes Doppler + Rician LOS on the GPU, materialising the per-tap coarse grid in block shared memory at slot start. Production path for all-leading-tdl topologies; landed Phase 2 D3 |
| process_superposition | the sole CPU / CUDA processor entry point; called by the broker for N-edge fan-in and by the benchmark / tests for the N=1 single-edge case (an earlier process_into API was unified away — see §20.2) |
| serve | one broker iteration for a destination node: read inputs from each source's ring, stage them, run the kernel, send the result over ZMQ |
| cursor | per-edge std::atomic<uint64_t> pointing into its source's IQ ring; co-initialised across edges so superposition aligns every edge's same virtual instant |
| pinned memory | host memory allocated with cudaHostAlloc; required for cudaMemcpyAsync to actually run async over PCIe DMA |
| Philox4_32_10 | NVIDIA's counter-based stateless RNG; same (seed, counter) always produces the same draw, so AWGN is bit-reproducible across runs and across thread schedules |
2.1 Diagram conventions
Every SVG diagram in this document follows the same visual taxonomy. Five semantic classes plus two modifiers; colour and shape encode the semantic class, not the topic. Skim this legend once; later sections use the conventions without re-introducing them.
3. System architecture — three layers
Zooming out before zooming in: every IQ sample makes a round-trip through three layers per slot. The external SDR layer is the user's existing software stack; the broker is this project; the GPU is where every per-sample math operation actually executes.
tcp:// · cf32 IQ in 23 040-sample / 1 ms slotscudaMemcpyAsync H2D / D2H · per-node cudaStream_tPart II — Configuration
Everything the user writes in YAML — the topology graph, the channel chain, and the physics the chain encodes.
4. Topology graph and YAML model
This section describes single-antenna radios. A radio with several
antenna ports groups its ports under radio_nodes: and its links then connect
radios rather than sockets; the schema, the matrix-index rule and the load-time rejections
are in §22. Everything below still holds — a
single-port radio is the Nt = Nr = 1 case,
and a topology that declares no radio_nodes: keeps exactly the behaviour and
the link keys described here.
The topology is a directed graph: nodes are devices (gNBs and UEs); edges are channel
edges between them, each with a named model. The broker reads
examples/topology.*.yaml and builds one
CudaLinkSlot per edge. The 3-node example below
(examples/topology.graph.cuda.yaml) carries both desired edges (downlink
+ uplink) and crosstalk edges (UE↔UE leakage).
rx_model noise floor, applied once
to the summed RX. The broker sums all edges arriving at each node.YAML in 10 lines:
runtime:    { backend: cuda, batch_samples: 23040 }
devices:    [ { id: gnb0, sample_rate_hz: 23040000, rx_model: noise_floor, … },
              { id: ue0,  sample_rate_hz: 23040000, rx_model: noise_floor, … },
              { id: ue1,  sample_rate_hz: 23040000, rx_model: noise_floor, … } ]
links:      [ { from: gnb0, to: ue0,  model: desired   },   # downlink
              { from: gnb0, to: ue1,  model: desired   },
              { from: ue0,  to: gnb0, model: desired   },   # uplink
              { from: ue1,  to: gnb0, model: desired   },
              { from: ue0,  to: ue1,  model: crosstalk },   # leakage
              { from: ue1,  to: ue0,  model: crosstalk } ]
models:     desired:     [ tdl{(0, -3 dB, 0)} · phase 0.1 rad · cfo 150 Hz ]
            crosstalk:   [ path_loss 40 dB · phase 0.7 rad ]
            noise_floor: [ awgn noise_power 0.01 ]
5. Channel models in YAML
Every model is a chain of named steps. The CPU and CUDA backends accept the same step
set and produce bit-exact output for any single edge (validated by
tests/test_processing.cpp). YAML keys per step type:
| Step type | YAML keys | Effect |
|---|---|---|
tdl | taps: block of {delay_samples, gain_db, phase_rad} (+ optional fading: sub-config and per-tap is_los / los_k_db / los_angle_rad) | Tapped delay line — the chain-leading propagation step. Each tap shifts the signal by delay_samples (integer or fractional, resolved by the shared 8-tap Hamming-windowed sinc in delay.h) and applies its complex tap weight 10gain_db/20·exp(j·phase_rad); with a fading sub-config each tap's weight becomes time-varying with a Jakes-shaped Doppler spectrum (plus optional Rician line-of-sight (LOS) specular). Applied device-side by default in apply_channel_kernel (§11 Diagram S) for any topology where every incoming edge has a leading tdl; falls back to host-side stage_link() calling apply_tdl_step{_fading} in delay.h for mixed-edge or non-tdl-leading nodes. Cross-slot history lives in a per-edge delay_line ring (in DeviceLinkState global memory on the device path, in the host LinkModelState on the fallback). A single tap with delay_samples = 0 is the static-gain case (subsumes the old gain step); a single tap with non-zero delay subsumes the old integer_delay / fractional_delay steps. The chain-leading constraint is enforced by validate_cuda_support; a non-leading tdl is rejected on the CUDA path (CPU accepts it anywhere). |
path_loss | path_loss_db | Scale branch, sign-flipped vs. gain — attenuation. step.a = 10−path_loss_db/20. |
phase | phase_rad | static phase rotation — step.a = phase, step.b = 0 |
cfo | cfo_hz | linear phase drift = carrier frequency offset — step.b = 2π·fcfo/fs |
awgn | noise_power or snr_db | additive white Gaussian noise (AWGN): complex Gaussian noise via counter-based Philox. Absolute mode: per-component σ = √(noise_power/2); SNR mode: noise scaled to running_power / 10^(SNR/10) |
Three named knobs for the chain-leading delay. Two
physically distinct effects compose into the same chain-leading delay step
(§9, Layer 2). The YAML exposes a named knob
for each so a topology can express each one cleanly; at config-load time
fold_link_leading_delays() sums them and merges the total into the
edge's effective chain.
| Knob | Scope | YAML key | Physical meaning |
|---|---|---|---|
| Propagation delay | per-edge | propagation_delay_samples on a LinkConfig |
Geometry-driven physical propagation along this specific edge. One sample at 23.04 MS/s is ~13 m free-space. Different outbound edges of the same source can carry different values. |
| TX timing offset | per-device | tx_timing_offset_samples on a DeviceConfig |
Constant TX-start-time lag of this endpoint — applies uniformly to every outgoing edge of the device. Models a radio that brought its ZMQ TX socket up later than the others. |
| Explicit chain step | per-edge (via model) | A leading tdl step in the model's chain |
The raw mechanism. Use directly when neither of the above scopes fits — e.g., a model that explicitly needs a multi-tap delay profile beyond a single propagation offset. |
Composition rules. All three are summed per edge.
If the model's chain already leads with a tdl step,
fold_link_leading_delays() shifts every tap's
delay_samples by the composed offset (preserving multi-tap
multipath structure); otherwise a single-tap tdl with the
composed offset is prepended. Fractional totals are carried through directly
by the polyphase-sinc resolution in apply_tdl_step. Negative
values for either named knob are rejected at load time. The per-edge
delay_line ring fills on the first serve and the composed offset
becomes constant for the run.
Worked example. A device with
tx_timing_offset_samples: 2 and a link from it carrying
propagation_delay_samples: 4 on top of a base model whose chain
starts with tdl{(1.0, 0 dB, 0)} ends up with a synthesised leading
tdl{(7.0, 0 dB, 0)} — the tap delay shifts from 1 to
1 + (2 + 4) = 7. At idx = 7 the receiver sees the source's sample 0. For a
runnable variant of this composition see
examples/topology.ocudu-docker.tx-offset.cuda.yaml — the same
single-cell OCUDU topology with a 4-sample tx_timing_offset_samples
on gNB plus a 3-sample propagation_delay_samples on the uplink
edge.
running_power in the AWGN SNR mode is the broker's
running estimate of the signal power at the point in the chain where the AWGN step
appears — built up by the host-side build_steps() walking the chain, so
placing AWGN earlier vs later in the chain gives different absolute noise levels for
the same snr_db. The rx_model for a node is just another model
— typically a single awgn step (the noise floor), but anything is legal.
The validator rejects delay steps in rx_model (they would have no defined
input signal).
6. Channel physics — Jakes, Rician, TDL profiles
Before the device kernel section that runs the math (§11), this section is the math itself: what a tap is, how the Doppler spectrum shapes a time-varying tap, why Rayleigh and Rician envelopes are not configuration knobs but consequences, and how the TR 38.901 §7.7.2 TDL profiles map onto the YAML schema. All implementation details follow the same wireless-modelling textbook (Bello / Jakes / Zheng & Xiao); the math here is the bit-exact reference both backends compute against.
Scope is TDL, not full CDL. The Clustered Delay Line (CDL) models in TR 38.901 §7.7.1 add per-cluster angles, polarisation, sub-ray geometry, and antenna array response on top of the basic tap structure. Those layers need beamforming machinery the broker does not have today; CDL stays out of scope. The 23-tap profile counts and example references below are TDL-A / TDL-B / TDL-C tables (TR 38.901 §7.7.2), not their CDL siblings.
Static taps — what tdl does
A single chain step on a single edge holds an array of
(delay, complex_gain) taps. The kernel sums
y[idx] = Σ ak · x[idx − τk]
in registers using one shared staged buffer plus a small
delay_line ring for cross-slot history.
Fractional delays from day one. Tap delays are
double samples; sub-sample offsets resolve via
the shared compute_windowed_sinc_taps helper in
delay.h (8-tap Hamming-windowed sinc, DC-normalised) — the
same coefficient generator both backends call out of
apply_tdl_step. This avoids snapping CDL delays to the
nearest integer sample (which would lose up to ~22 ns of delay-spread
fidelity at 23.04 MS/s).
What it buys. Static frequency-selective channels — 3GPP TDL profiles (TR 38.901 §7.7.2 tables 7.7.2-1 through 7.7.2-5), 2-ray ground-reflection, indoor multipath. Memory cost is roughly the same as a single-tap edge today and ~24× lower than the naive "one parallel edge per tap" approach for a 23-tap TDL-A profile, because the cross-slot history is one ring per edge rather than one per tap.
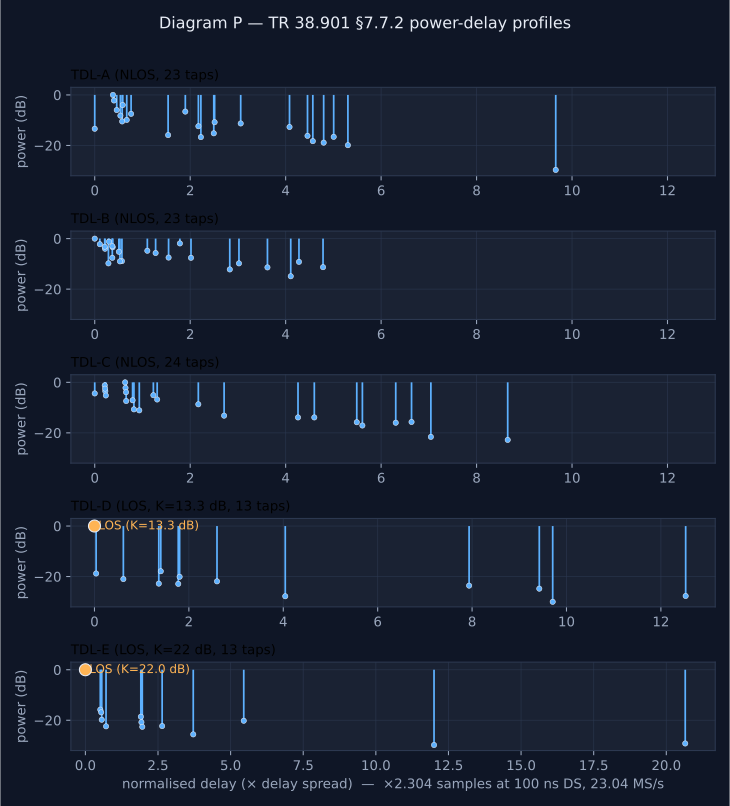
los_k_db sets the Rician K-factor (13.3 dB for TDL-D,
22 dB for TDL-E). Scaling to samples at the project's 23.04 MS/s
reference rate and 100 ns delay spread multiplies the x-axis by 2.304.
Regenerated from the same Sionna JSON the project's example YAMLs use;
produced by scripts/figures/regen_fading_figures.py.Time-varying tap gain — the fading sub-config (Phase 1.4, landed)
The fading sub-config shipped in Phase 1.4 (commits
61d76bb for the schema / parser / validator and
e48e95c for the Jakes kernel + LOS Rician composition). The
description below tracks what the running code does today; planned
extensions (the Gaussian and Flat spectra reserved in the enum) are
flagged where they would slot in.
The model. When the step's fading sub-config is
enabled, each tap's complex gain
ak(t) becomes a zero-mean complex
stationary Gaussian process. The single knob that defines the
shape is the tap's Doppler power spectrum
Sk(f) — equivalently, the temporal
autocorrelation Rk(Δt), since one
is the Fourier transform of the other (the WSSUS framework, Bello 1963).
Everything else about the tap follows from that single choice.
Default spectrum: Jakes' classical (per edge, not per tap). Cosine-symmetric around 0 Hz, parameterised by a single per-edge max-Doppler frequency fd,max = v · fc / c set by the UE velocity — stationary radio mismatch ≈ 0 Hz, pedestrian at 3.5 GHz ≈ 11 Hz, car ≈ 350 Hz. All taps share the same fd,max; the per-tap variation comes from each tap's own random sub-ray angle draws, not from different velocities per tap. Other spectra (Gaussian, flat) drop in as alternate generators behind the same sub-config; the cluster-specific spectra of full CDL are out of scope here as noted above.
Envelope statistics fall out — they are not a separate knob. A zero-mean complex Gaussian process has a Rayleigh envelope by construction; there is nothing to configure. A Rician envelope is the same Gaussian process plus a deterministic LOS path (its own gain, delay, and Doppler shift), and the K-factor is just the LOS-to-scattered power ratio. So "Rayleigh vs. Rician" is a topology question (is there a deterministic LOS tap alongside the faded ones?), not a fading parameter.
Per-tap variation comes from sub-ray angles, not from different
velocities. The per-edge
fd,max is the bound; each tap
independently draws M ≈ 20 random sub-ray
angles αk,m uniform in
[0, 2π), and the tap's instantaneous
contribution at time t is the sum-of-sinusoids
ak(t) ∝
Σm exp(j(fd,max · cos(αk,m) · t +
φk,m)). The Jakes spectrum emerges from the cos(α)
projection of a common fd,max over
many sub-rays — exactly what Sionna's TR 38.901 TDL implementation does
(tr38901/tdl.py) and what Zheng & Xiao (2003) derive
as the WSS-correct improved Jakes generator. The LOS variant
(TDL-D / TDL-E) adds a deterministic specular component to the first
tap with Doppler shift
fd,max · cos(αLOS) —
also derived from the same per-edge
fd,max, not an independent
per-tap value.
Implementation. Per-tap sum-of-sinusoids with
M = 20 sinusoids per tap (the Zheng-Xiao /
Sionna convention; the Jakes generator's WSS error is bounded once
M ≥ 8, and 20 is the published default).
prepare_tdl_fading_state in
include/ocudu_gpu_channel/delay.h draws the
M angles αk,m,
the M initial phases
φk,m, and a per-tap LOS initial phase
from std::mt19937_64 seeded by
hash("<link_key>:fading:<step_idx>")
— both backends compute the same seed, so the CPU and CUDA fading
realisations come from the same random sequence. To bound kernel cost,
the generator produces gk(t) on a
coarse grid (default grid_us = 100 — 10 kHz, ~28× oversampling
vs. a 350 Hz Jakes spectrum) with phase accumulation (one complex
multiply per sub-ray per grid step, not a sin/cos pair), then linearly
interpolates up to per-sample resolution. The interpolation error sits
well below any AWGN floor for any realistic
fd,max. LOS taps add a deterministic
specular component with its own per-sample phase accumulator (also no
per-sample trig), composed via the Rician
[√(K/(K+1)), √(1/(K+1))] factor split.
Gaussian and Flat spectra are reserved in the
FadingSpectrum enum (so YAMLs can already declare them) but
their generator math is not implemented; the kernel throws on
encountering them — a later-phase drop-in.
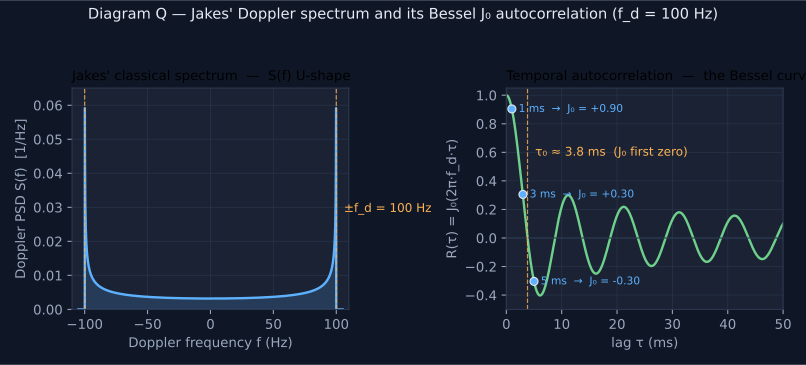
tests/test_processing.cpp). fd = 100 Hz
matches the project default.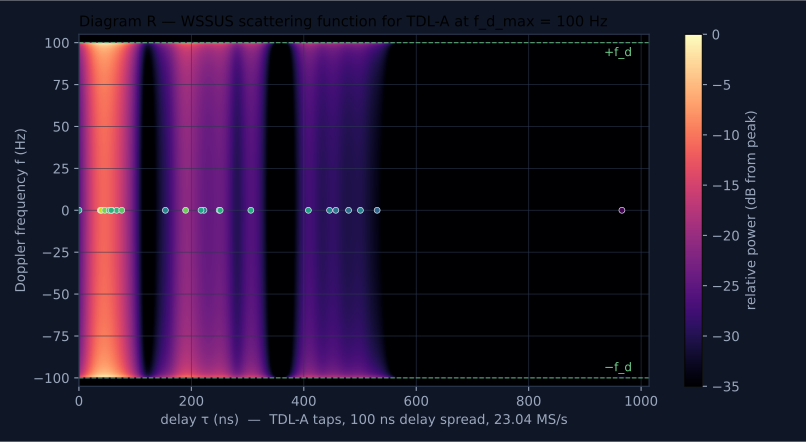
TDL profile YAMLs (Phase 1.5, landed)
The five canonical 3GPP TR 38.901 §7.7.2 profiles
(TDL-A through TDL-E) ship as ready-to-run example
topologies in
examples/topology.tdl-{a,b,c,d,e}.cuda.yaml. Each YAML is a
bidirectional gNB↔UE pair with the profile applied to both edges.
Translation rule. The published normalised delays are scaled to samples at the project's 23.04 MS/s reference rate and a 100 ns desired delay spread: delay_samples = normalised · 100 ns · 23.04 MS/s = normalised · 2.304. Tap powers are carried verbatim. The Doppler default is fd,max = 100 Hz (≈30 km/h at 3.5 GHz, vehicular) with the Jakes spectrum.
LOS profiles (TDL-D, TDL-E). TR 38.901 publishes two
zero-delay entries on the first cluster — the LOS specular and the
co-located Rayleigh component — whose dB ratio is the cluster's
Rician K-factor. The kernel composes both inside one tap via
g(t) = √(K/(K+1))·specular + √(1/(K+1))·rayleigh,
so the YAML carries a single tap with
is_los: true, los_k_db set to the published
ratio (13.3 dB for TDL-D, 22 dB for TDL-E), and
los_angle_rad: 0 (LOS co-axial with motion, maximum
positive Doppler). TDL-E additionally combines two co-delay scatterer
clusters at normalised 0.5440 — TR 38.901 separates them for spatial
modelling, but the TDL form has no per-tap angles, so their linear
powers are summed into one tap (−16.86 dB combined).
Perf measurement. scripts/remote/perf-fanin-sweep.sh
picks up two CDL-shaped configs at the end of its existing
one-to-N / M-to-N grid: a 1-edge TDL-A baseline (the demo YAML above)
and an 8-UE fan-in TDL-A
(examples/topology.perf-tdl-a-fanin-8.cuda.yaml — 1 gNB +
8 UEs, TDL-A on all 16 edges). The pair shows how the multi-tap
convolution + Jakes generator scales with fan-in under realistic
multipath, instead of only the single-tap cuda_mvp path.
Source of the published numbers: Sionna
(references/code/sionna/src/sionna/phy/channel/tr38901/models/TDL-{A..E}.json,
Apache-2.0), which itself transcribes TR 38.901 Tables 7.7.2-1
through 7.7.2-5.
What this replaced (Phase 1.3, landed)
tdl shipped in Phase 1.3 (commits
9afb2de → aa006a9 on main) and
subsumed three earlier single-tap chain steps that no longer exist in
the schema:
gain→ a one-taptdlwith delay_samples = 0 and the chosen complex gain.integer_delay→ a one-taptdlwith the integer delay and unit gain.fractional_delay→ a one-taptdlwith the fractional delay and unit gain.
All example YAMLs, all tests, and the perf-sweep scripts were
migrated to the tdl shape in the same Phase 1.3 sequence.
The per-edge delay knobs
(device.tx_timing_offset_samples,
link.propagation_delay_samples) kept their semantics but
now fold into the chain-leading tdl step
(§9 describes the composition rules). The
path_loss, phase, cfo, and
awgn steps were unchanged — they remain as separate per-
sample steps because they are not multipath operations.
Doppler in current code. Two complementary
paths now ship: a deterministic Doppler shift (no spread) via the
existing cfo chain step — set cfo_hz to
fd = v · fc / c for a
link-wide constant offset; and a stochastic Doppler spread via
the tdl step's fading: sub-config (Phase 1.4)
— the per-tap Jakes-shaped spectrum that emerges from sub-ray angles
within each cluster, all bounded by the same per-edge
fd,max, plus optional per-tap
Rician LOS specular for TDL-D / TDL-E-style profiles.
Part III — Runtime — one slot at a time
The per-slot data path, in execution order: align → pack → channel → superpose → RF impairments.
7. End-to-end serve flow — one slot at a glance
Diagram F (§3) showed the three layers; this section is the single most-useful diagram in the doc — one destination node's serve, start-to-finish. Every later section is a deep-dive into one box of this picture.
8. The broker — per-slot loop
Reader note. This section names machinery covered in detail in §9 (alignment), §10 (staging), §5 (channel models), and §11 (kernels and pipeline, with op-order in §11.0). The §2 glossary defines every term used here as a one-liner, so a first read can proceed top-to-bottom; the deeper "why" for each named component lives in the cross-referenced section.
Thread structure, stated once. The per-slot work of a destination node is split across two threads rather than one: a producer per radio node chooses the window, runs the pipeline and publishes each output row, and a thin REP worker per port owns only the socket state machine. The split is what makes a multi-port radio's ports share one window by construction, and its reasoning is in §23. For a single-port radio the two threads do between them exactly what the single server thread described below did, in the same order, so this section reads correctly either way — "the server thread" below means "the producer, then its REP worker".
The broker runs one producer per destination node. It reads the common window of samples available across all of the node's incoming edges, stages them into pinned memory, runs the GPU pipeline, and hands the processed IQ to the node's REP worker(s), which reply to the downstream radio's requests. Two producers for the same node never coexist; producers for different nodes run in parallel and use independent CUDA streams (see §16).
Receive-side rings are written by a separate set of RX threads — one per source — that pull TX packets from each source's PUB socket and append samples (with a monotonic sequence number) to a per-source ring buffer. The server thread only reads from these rings; it never writes to them.
Node ↔ edge mapping (the per-server-thread invariant).
The YAML topology is two flat lists — devices: (nodes) and
links: (directed edges with from / to
/ model). When the broker spawns the server thread for
destination device d, it resolves that node's
incoming-edges set by filtering the global links once at startup:
incoming = { i : links[i].to == d }
(src/broker.cpp:420-425).
From that list it builds a fixed per-thread
std::vector<SuperpositionInput> superposition, where
each entry holds the edge's link_key (the processor's state
map key) and a pointer to its model. That vector is then the
index space for everything the server does per slot — one cursor
per incoming[k] in alignment co-init (§9), one
ring read per incoming[k] in the common-window
read, one stage_link() call per incoming[k]
to apply that link's h(src→dst)(t, τ)
into staged slot k (§11), and the kernel's
per-thread inner loop walks k = 0 … incoming.size()−1
to sum across edges (§12). The mapping is computed once at broker startup
and is fixed for the run; the per-slot loop never re-resolves it.
Broker::prepare()
filters the global links[] once per destination
(incoming = { i : links[i].to == d.id }) and builds
a fixed per-server-thread vector
superposition[k] = { link_key, model* }. This entire resolution
lives on the host. Bottom row (use): every slot the server thread
walks k = 0 … N−1 on superposition[k]
to drive cursor co-init, ring read, and the pack into
host_source_iq. D4 source rebuffering: the pack writes
one slot per UNIQUE source (not per edge) — edges sharing a source share
one slot. The per-edge channel math
(apply_tdl_step_fading from delay.h) runs on the
GPU as apply_channel_kernel by default; host
stage_link() only runs as the fallback when a destination has any
non-tdl-leading incoming edge. The device kernel never sees
superposition[] directly — it sees the packed result
(device_source_iq[s · count + idx] indexed per edge via
DeviceLinkState::src_index, plus per-edge
DeviceLinkState + step_meta[2N]) built host-side
from superposition[] and shipped via H2D. H2D bytes per slot
scale with source count, not edge count.The per-serve sequence in src/broker.cpp is a strict pipeline —
align → read → delay → stage → kernel → return → throttle → advance. Each
later stage assumes the guarantee the previous one made. The shape, laid out by
resource (which thread / which device does the work) reads like this:
host_source_iq, GPU→CPU after D2H, CPU→ZMQ after the throttle
anchor hits). The per-edge channel work that used to live in CPU stage 4
(stage_link) now runs on the GPU as sub-phase 6b
(apply_channel_kernel — multi-tap convolution + Jakes + Rician
LOS); the host CPU lane is now mostly just packing + step_meta build. Host
fallback path: if any incoming edge is non-tdl-leading, the dispatch gate
goes false and stage 4 reverts to host stage_link writing the
shaped IQ into host_staged, with 6b collapsed back to just the
copy — see §11 Diagram S for the gate.
Section refs (§) link to the dedicated sections.Detail per stage:
- Wait for REP request on the node's socket.
- Align — first serve: co-init every incoming-edge cursor to its source
ring's
earliest_sequence()so all edges share an epoch (sequence 0). Subsequent serves: cursors are already aligned because they only ever advance together (step 8). Compute the common windowserve = min(batch, min over k of (next_seq − cursor))— the largest slice every edge can supply. If the window is zero the thread polls again, andrx_starvationsincrements if the wait exceeds the starvation deadline. Detail in §9 + Diagram H. - Read the common window from each source ring at its cursor — N separate
per-edge sample arrays, each
servesamples long, all representing the same source-time slice. - Apply per-edge leading propagation — by default on the device kernel
apply_channel_kernel(Phase 2 D3 + D4): raw IQ is packed per UNIQUE source intohost_source_iq(D4 source rebuffering — N edges sharing a source share one slot, indexed byDeviceLinkState::src_index), ships H2D intodevice_source_iq, the kernel materialises per-tap Jakes coarse grids in block shared memory and writes shaped IQ intodevice_staged. Host fallback viastage_link()runs the same math indelay.hwhen the per-node dispatch gate doesn't fire (mixed-edge or non-tdl-leading nodes). Edges without a leading tdl just get a plain copy. Detail in §10 top prose, §5 tdl row, and §11 Diagram S. - Stage — only used on the host-fallback path: pack the N per-edge arrays
back-to-back into the pinned
host_stagedbuffer for one H2D copy. The device-default path skips this entirely (it useshost_source_iqdirectly). Detail in §10 + Diagram J. - Kernel —
process_superpositionruns the H2D, launchessuperpose_kernel(+ optional in-placerx_modelpass), and does the D2H. Detail in §§11–13. - Throttle then ZMQ REP send — sleep until
throttle_anchor + served / rate(so wall-clock matches virtual time), then reply with the processed IQ. - Advance cursors by
servesamples on every edge — keeps them aligned for the next serve.
9. Signal alignment and time discipline
Three layers of alignment compose to make the emulator behave physically:
- Sequence-aligned superposition — every incoming-edge cursor reads from the
same virtual time slice on every serve, so the kernel's
staged[k·count + idx]for differentkalways represents the same instant in source time. - Per-edge propagation delay — a chain-leading
tdlstep shifts an edge back in time (and optionally splits it across multipath taps), with continuity preserved across slot boundaries via a per-edgedelay_linering (inDeviceLinkStateglobal memory on the device path, inLinkModelStateon the host fallback). - Wall-clock throttle — the producer sleeps to pace serves at exactly the sample rate, so virtual time = real time. It paces to that rate and no faster, and it will not make up time it lost while blocked: a lock-step radio has no clock of its own, so the emulator is its clock, and a burst of catch-up is what a multi-port ZMQ radio dead-locks on rather than absorbs (§23.1).
- One epoch per radio — on a multi-port radio, all ports advance on the same window, chosen once by one thread and cut on the same boundaries all the way to the wire (§23). Per-port state that can drift independently is not an acceptable implementation of a matrix channel.
Diagram H is one moment — a single serve. Diagram L shows the same cursors evolving across many serves: every cursor advances by serve samples per step, and a wall-clock throttle pins each serve boundary to real time so virtual time tracks real time for the life of the run.
Diagrams H and L describe alignment between sources — the same virtual
time index reaches every ring at the same moment. Diagram M zooms in on what
happens after alignment: each per-edge leading tdl step
shifts its source's contribution by an independent per-edge delay
dk, so the same virtual instant arrives
at different points along each edge's tap timeline.
tdl with delay dk (for the single-tap case the
diagram illustrates; multi-tap produces several echoes at dk, dk+τ₁, …
in parallel). At idx = 7 the receiver integrates
src 0's sample 5 (= 7 − d0) and
src 1's sample 2 (= 7 − d1). dk
composes propagation distance and constant TX offset into one per-edge knob — the
emulator cannot distinguish them.Layer 2 in detail — what dk bundles together. dk in the diagram above is the chain-leading sample-delay step on the edge, and it absorbs two physically distinct effects. The receiver can't tell them apart, but the YAML exposes a named knob for each so a topology can express each effect cleanly:
- Propagation delay — a per-edge, geometry-driven physical
propagation time. A source farther from the receiver in the topology
corresponds to a larger contribution. One sample at the OCUDU / srsRAN
sample rate (≈ 23.04 MS/s) is ~13 m of free-space propagation, so a 100 m
edge is roughly 8 samples. YAML knob:
propagation_delay_sampleson the edge. - TX timing offset — a per-source, constant TX-start-time lag. If a
radio brought its ZMQ TX socket up later than the others, every sample it
produces is shifted in virtual time by exactly that constant.
Indistinguishable from being farther away by the same number of samples,
so the broker folds it into the same chain-leading delay step. YAML knob:
tx_timing_offset_sampleson the device — applies uniformly to every outgoing edge.
At load time, fold_link_leading_delays() composes
these two knobs with whatever leading tdl step the edge's model
already has: if the chain leads with a tdl, every tap's
delay_samples is shifted by the summed offset (preserving multi-
tap multipath); otherwise a single-tap tdl is prepended with the
offset as its tap delay. dk for an edge is the sum of all three
sources — see §5 for the YAML recipes.
What is not modeled at this layer: any time-varying offset (clock drift, slot misalignment that grows over time, sample-rate mismatch between endpoints) is out of scope. dk is constant for the life of a serve and changes only when the YAML is reloaded — drift would require a runtime-mutable per-edge delay, which is on the planned list in §26.
What this stage guarantees for everything downstream: after this step, the broker holds N per-edge sample arrays that are (a) all exactly serve samples long, and (b) whose element at index idx represents the same source-time instant on every edge. The next stage (§10, staging) takes these aligned arrays as given and concatenates them; the kernel (§§11–13) takes the staged buffer as given and sums staged[k·count + idx] across edges to produce the node's RX sample at instant idx.
10. The staged buffer — packing N edges for one H2D
"Staged" is the word for what the broker hands to the GPU each serve. By the time
the broker reaches this stage, §9 has already
guaranteed that the N per-edge sample arrays are
time-aligned — every edge's sample at index idx
represents the same source-time instant, and every array has the same length
serve. (If a per-edge leading tdl step
applies, either apply_channel_kernel on device or
stage_link() on host has already run that step's multi-tap
convolution + optional Jakes fading using the per-edge delay_line
ring for cross-slot history — see §11 Diagram S for
which path runs when.) Staging is purely a packing step — it takes those
N aligned, delay-applied arrays and concatenates them
back-to-back into one pinned buffer (host_staged) so a single
cudaMemcpyAsync ships the whole block. The kernel then addresses any
edge's any sample with one formula:
staged[k·count + idx] = edge k's
sample idx.
count samples longWhy pack at all?
- One H2D, not N. Each
cudaMemcpyAsynccarries fixed per-launch overhead; for N=2 that doubles, for N=8 it's 8×. A single contiguous copy amortises it. - Single-pointer kernel argument.
superpose_kerneltakes onestagedpointer plus the integercount; the address formula derives any (edge, sample) pair without extra metadata. - DMA + L2 friendly. Contiguous memory plays well with the GPU's copy engine and the L2 prefetcher.
Sizing. Each IQ sample is 8 bytes (two float32).
For the canonical 23 040-sample slot and a 2-edge node:
2 × 23 040 × 8 B = 360 KiB per serve. Even a 16-edge node
caps at 2.88 MiB — comfortably under any current GPU's L2 (50 MiB on H100, 128 MiB on
B200). For RTX 5090's wider memory bus, 360 KiB clears L2 in tens of microseconds.
11. The channel — applied per edge (device kernel by default, host fallback)
The wireless channel h(src→dst)(t, τ) is a per-edge object: each incoming edge of an RX node carries its own delay spread, Doppler shift, and LOS K-factor, parameterised by the YAML tdl step plus its optional fading sub-config. The broker applies that channel per edge, before the staged buffer reaches superpose_kernel. The kernel that follows never sees raw, un-channelised IQ from any source.
Per-edge invariant. Multipath and Doppler are applied independently per edge, with each edge's own delay-line ring and Jakes sub-ray state, before aggregation. The channel h(src→dst)(t, τ) is a property of the edge, not the receiver — summing raw IQ before applying the channel would collapse the per-edge statistics and is mathematically wrong.
The default path is the device kernel apply_channel_kernel in src/device_channel.cu (Phase 2 D2b + D3 + D4, landed): per-edge state lives in DeviceLinkState in GPU global memory, the per-tap Jakes coarse grid is materialised cooperatively in block shared memory at each slot's start, and each output sample is computed by one CUDA thread reading device_source_iq[s->src_index · count + read_idx] + interpolating gk(tidx). The src_index indirection (D4) means edges sharing a source share a single input slot — the host packs each unique source once. H2D bandwidth therefore scales with source count rather than edge count when multiple edges share a source; for current production topologies (one edge per (from, to) pair) the byte count is unchanged. See §20.6 for the empirical confirmation. The host fallback is stage_link() calling apply_tdl_step{_fading} in delay.h — used when the per-node dispatch gate (CudaSuperposeState::use_device_channel, set in prepare()) doesn't fire, i.e. when an incoming edge has no leading tdl step. Both paths share one numerical specification in delay.h; the CPU↔CUDA fading bit-exact test asserts agreement at 1e-3 tolerance. The math itself lives in §6 (Diagrams P / Q / R).
11.0 Pipeline op order — what each stream actually launches
Before the per-component deep dives (Diagram S below, then dispatch
gate / lifecycle / polyphase / ring continuity), here is the strict
per-serve op order on one destination's stream. Memory buffers below are
defined in the memory-map section (Diagram D); cudaEvents bracket H2D /
kernel / D2H so each phase is measured independently in the
event=gpu_timings log.
Device-channel path — default when every incoming edge of the
destination has a leading tdl step (gate
sp.use_device_channel == true, see §11.1):
- Per-source pack (D4):
memcpyeach unique source's raw IQ window into host_source_iq[s·count]. Multiple edges that share a source write the same slot once — saving (link_count − num_sources) × count IqSamples of H2D bandwidth per slot. Source-to-slot mapping built once atprepare(); each edge'sDeviceLinkState::src_indexidentifies its slot. - 3× H2D (or 4× with
rx_model): host_source_iq → device_source_iq (sized by num_sources × count, not link_count × count), host_steps → device_steps, host_step_meta → device_step_meta, (optional) rx_steps. apply_channel_kernel— multi-tap convolution + Jakes + Rician LOS per edge. Each thread block reads device_source_iq[s->src_index · count + i] — edges sharing a source share the input slot, then apply their own per-edge channel state. Writes device_staged[k · count + idx].update_delay_line_kernel— roll each edge's delay_line ring forward by count samples; advance slot_start_samples (cross-slot continuity, §11.4). Reads source IQ via the same src_index indirection.superpose_kernel— sum every edge's per-sample chain output into device_output.apply_steps_kernel(only whenrx_modelis set) — in-place receiver chain, typically a single AWGN noise floor.- D2H: device_output → host_output; broker copies into the caller's span.
Host-fallback path — for destinations with at least one
non-tdl-leading incoming edge (gate false):
- Host
stage_linkwrites already-shaped IQ into host_staged per edge. - H2D: host_staged → device_staged
(skipping
apply_channel_kernel+update_delay_line_kernel). superpose_kernel+ (optional) rx_model + D2H, identical to steps 5–7 above.
Both paths converge at device_staged and
share superpose_kernel downstream — the dispatch difference
is only where the per-edge channel ran, not the surrounding
pipeline.
tdl step
(apply_channel_kernel runs the convolution + Jakes + LOS
on the GPU; update_delay_line_kernel rolls the cross-slot
ring; the Phase 2 D3 + D4 path); HOST FALLBACK otherwise
(stage_link calls apply_tdl_step{_fading}
from delay.h on the host, ships already-shaped IQ via
H2D). Both paths converge at device_staged with the same
layout; superpose_kernel (§12) downstream is path-agnostic.
Math + state internals are in the sub-diagrams:
SG (gate),
X (per-edge state lifecycle),
Y (8-tap polyphase read),
Z (cross-slot ring),
§6 (channel physics). CPU↔CUDA agreement at
1e-3 tolerance is asserted by the parity tests in
tests/test_processing.cpp.Once the per-edge channel has been applied — by apply_channel_kernel on the GPU (default), or by host stage_link() on the mixed-node fallback — the staged buffer contains N slots in which the channel has been fully applied. From this point on, the kernel only needs to apply the memoryless RF impairments per sample (§13) and sum across edges (§12).
11.1 Dispatch gate — when the device path engages
ProcessorTimings.used_device_channel; guarded
by tests/test_processing.cpp:911 (leading-tdl ⇒ true) and
:935 (leading-non-tdl ⇒ false).11.2 Per-edge state lifecycle — prepare once, serve many
DeviceLinkState lifecycle. Built once
in prepare() from the YAML, copied H2D, then immutable
except for the per-edge delay_line ring and
slot_start_samples counter that the second kernel rolls
forward each slot. This is what makes the per-edge channel a pure
function of (state, raw IQ in) → (shaped IQ out, new state) — no
malloc / lookup / lock on the hot path, no host round-trip during the
serve. Read-only fields (alphabetical):
src_index (D4: which slot of device_source_iq this
edge reads from), tap_delay_int / tap_frac / tap_gain_amp /
tap_cos_phi / tap_sin_phi / tap_polyphase[K][8] / fading_enabled /
f_d_max_hz / grid_us / tap_alpha[K][M] / tap_phi[K][M] / tap_is_los /
tap_los_factor / tap_rayleigh_factor / tap_los_angle_rad / tap_phi_los;
mutable fields: delay_line[dl_size] / slot_start_samples.11.3 Polyphase 8-tap fractional-delay filter
The tdl step's per-tap convolution is an 8-tap
Hamming-windowed sinc filter centered around the fractional-delay phase.
Both apply_tdl_step{_fading} in delay.h and the
device kernel call the same compute_windowed_sinc_taps(frac, h[])
helper at prepare time and use the cached coefficients per slot.
τ = tap.delay_samples splits into τ_int = floor(τ)
and frac = τ − τ_int ∈ [0, 1). The integer part chooses the
window center (i = 3 reads idx − τ_int); the
fractional part picks the polyphase coefficient set h[0..7]
(precomputed via compute_windowed_sinc_taps(frac, h[]) at
prepare). With read_idx = idx − τ_int + 3 − i, the window
spans 4 past samples (i = 4..7) and 4 future / current samples (i = 0..3)
around the center. Out-of-range reads zero-pad. CPU and CUDA both call
the same coefficient helper, apply the same indexing, and zero-pad the
same way — this is the surface the bit-exact parity test guards.11.4 Cross-slot delay-line ring continuity
Multi-tap channels have echoes longer than one slot's worth of input.
The per-edge delay_line ring keeps the most recent
dl_size raw input samples around so that the next slot's
polyphase reads can resolve negative read_idx against history
instead of zero-padding. The ring is rolled at the END of each slot by
apply_tdl_step (host) or update_delay_line_kernel
(device); the two implementations are bit-equivalent.
delay_line ring is the bridge
between adjacent slots. The last dl_size samples of slot
N−1's in_buffer get written into delay_line by
update_delay_line_kernel; slot N's
apply_channel_kernel reads them back when its 8-tap filter
reaches into negative read_idx (i.e. earlier than this
slot started). The bytes are physically the same — 32 samples copied
once at the boundary — but logically they straddle the slot edge so a
multi-tap echo born in slot N−1 lands correctly in slot N. Slot N's own
tail then becomes the ring for slot N+1 (dashed arrow), and so on.
Without this, every slot boundary would have a ~12 µs discontinuity at
23.04 MS/s — a measurable spectral edge that would corrupt every
multi-tap channel test. slot_start_samples advances by
count in the same kernel so the Jakes phase generator
(Diagram Q) picks up exactly where it left off.12. Superposition — N edges summed per GPU thread
The kernel pulls together the per-edge channel work (§11) and the per-sample RF impairments (§13) along two parallel axes. 23 040 threads wide — one per output sample — × N edges deep — each thread loops over the staged edges and accumulates their post-impairment IQ. The accumulation itself is the superposition: the linear sum of every TX signal arriving at the RX after each has been through its own channel.
Axis 1 — one thread per output sample
A 1 ms slot at 23.04 MS/s is exactly 23 040 IQ samples; the kernel launches with that many threads (90 blocks × 256 threads) and each thread idx owns one output sample out[idx]. There is no cross-thread communication on this axis — every output sample is independent — so the SIMT mapping is direct. Diagram A shows the launch geometry.
Axis 2 — each thread sums the whole interference graph
For a node with N incoming edges, the broker stages the N source batches back to back into one pinned buffer and launches one superpose_kernel. A small step_meta array packs each edge's offset into the flattened step list (the first N entries) and step count (the next N entries), so thread idx can walk every edge for its sample, shape it through that edge's own chain (§13), and accumulate — that accumulation is the interference.
Two parallel axes multiply: 23 040 samples wide (one thread each) × N edges deep (the per-thread loop). The 3-node graph's 2-edge nodes are ≈ 46 000 complex channel evaluations per launch. The static superpose_kernel in isolation measures at 5–9 µs on the RTX 5090; the Phase 2 device channel kernel (multi-tap + Jakes + LOS) adds the per-edge channel work and runs ~97 µs at tdl-a_E16 — still well inside the slot deadline. See §20 for the full perf record.
13. RF impairments — the device-side per-sample chain
After the channel has been applied per edge (§11), the kernel applies the remaining chain steps per sample. These steps are memoryless — every one either reads only the current (i, q) state or generates its noise from a counter-based RNG with no cross-thread dependency. That memorylessness is what makes them ideal for the SIMT model: every thread can run the chain independently.
Inside the per-thread loop of superpose_kernel (and in the body of apply_steps_kernel for an rx_model), each thread loads one (i, q) pair into registers and walks the link's chain via apply_chain(). The chain is a flat array of GpuStep structs built host-side from the YAML model; every iteration switches on step.type to apply one of three operations, each mutating the same (i, q) state in place. The same machinery serves every model in the topology — "desired" is tdl + phase + CFO (the leading tdl ran already in apply_channel_kernel on device — or stage_link() on host fallback — so on the device per-sample chain it is a no-op pass-through, leaving phase and CFO as the actual per-sample work); "crosstalk" is path-loss + phase; the receiver noise_floor is a single AWGN step.
Runtime mutability. The chain-step params read by
this per-sample loop (and the tap layout that §11
feeds it) are live-mutable at slot boundaries via the ZMQ control plane
described in §17. The per-sample chain
itself doesn't know — it always reads from live; the
shadow → snap publish happens at the top of the slot before
the per-thread loop launches.
step.type; (i, q) live in
registers throughout, no shared memory needed. The chain's order and length come from
the YAML config. What's not shown here: the leading tdl step —
multi-tap convolution, per-tap Jakes fading, and Rician LOS specular — was already
applied before this kernel ran, by apply_channel_kernel on the
device (default path) or by stage_link() on the host (fallback for
mixed-edge nodes). Either way, the per-sample chain here reads already-shaped IQ
out of device_staged and the tdl step is a no-op
pass-through Scale(1.0). See §10 for the staging layout and
§6 Diagrams P / Q / R for the channel-physics picture.That completes the per-slot data path: align (§9) → pack (§10) → per-edge channel (§11) → superpose (§12) → per-sample chain (§13). Everything from here on is supporting infrastructure — the CPU / CUDA backend pair that runs the chain, the signal memory map both halves of the pipeline share, and the multi-stream concurrency that lets the GPU serve N destinations in parallel.
Part IV — System integration
Cross-cutting infrastructure that supports the data path — the CPU/CUDA backend pair, signal memory, and stream concurrency.
14. Processor backends — CPU and CUDA
There are two backends behind a common ChannelProcessor interface
(include/ocudu_gpu_channel/processing.h): CPU for correctness
reference and local development, CUDA for production scale. Both expose a
single entry point:
process_superposition(dst_node, edges, rx_model, rate, out)— shapes every incoming edge ofdst_nodethrough that edge's own channel model, sums them, and applies the node's optionalrx_modelonce to the sum. The broker uses this for N-edge fan-in; the benchmark and unit tests use the same call with a one-elementedgeslist (the N = 1 single-edge case) instead of a separate per-edge API.
Bit-exactness contract: for any single edge,
process_superposition on CPU and CUDA produces identical
cf32 output within 1e-3 per sample. This is enforced by
tests and matters because it lets us debug regressions on the CPU path
before reproducing on the GPU. The shared inline implementation of
apply_tdl_step + apply_tdl_step_fading in
include/ocudu_gpu_channel/delay.h and the counter-based
Philox RNG are what make this practical.
Both backends implement the same step surface. The
CPU backend's process_superposition calls the same
apply_tdl_step_fading helper as the device-channel kernel,
so multi-tap convolution + Jakes Doppler + Rician LOS all work on CPU
too — just slower. The 1e-3 parity tolerance accommodates one cycle of
trig precision difference (std::cos(float) on CPU vs
__sincosf on GPU); pre-trig angles are computed in
double and reduced mod 2π on both sides so long-running
parity holds. The CPU backend is therefore the trust anchor: every
feature CUDA ships, CPU runs first and the test suite asserts they
match.
15. Signal memory — pinned host buffers paired with device buffers
The per-slot pipeline that §11.0 describes moves
data between two halves of a memory map: a
pinned host side (allocated with cudaHostAlloc so cudaMemcpyAsync is
truly asynchronous over PCIe DMA) and a matching device side
(cudaMalloc in GPU global memory). Each state owns its own
cudaStream_t (non-blocking) plus a quartet of cudaEvent_ts that
bracket H2D / kernel / D2H for the event=gpu_timings log line.
Two state structs hold the broker's signal memory:
CudaSuperposeState (one per destination node — the broker's
only hot-path state) and CudaLinkSlot (one per emulator
edge, holding the per-edge chain phase / AWGN counter / delay_line ring).
The process_superposition call walks every incoming edge's
CudaLinkSlot to pack the staged buffer, then does one
fused H2D + kernel + D2H against the per-destination superpose state.
CudaLinkSlot holds only the per-edge
chain-running state (phase / AWGN counter / delay_line) — no scratch.Analytical footprint per RX node. For N incoming edges, a chain of S steps, and a batch of count IQ samples (8 bytes each):
- Staged buffer — 8 · N · count bytes, allocated twice: pinned on host, mirrored on device. At N = 8, count = 23 040: ~1.4 MiB per side.
- Output buffer — 8 · count bytes per side. ~180 KiB.
- Steps buffer — sizeof(GpuStep) · N · max_steps bytes per side. At sizeof(GpuStep) = 24, max_steps = 5: ~960 B per N=8 node — tiny.
- delay_line ring — per edge, 8 · (d + 2) bytes host-only, where d is the chain-leading delay in samples. Negligible unless d is huge.
Total device footprint for an 8-incoming-edge node at 23.04 MS/s fits comfortably in any GPU's L2 (50 MB on H100, 128 MB on B200), and even the full 16-edge stress topology stays in L2. Bandwidth, not capacity, is the working constraint — quantified in §20.6.
16. Multi-stream concurrency — overlapping serves
Each destination node has its own cudaStream_t + thread, so the per-serve
H2D → kernel → D2H sequence runs concurrently across nodes. With three nodes the GPU is
rarely idle: while one node's kernel is running, another's H2D and a third's D2H can be
in flight on the GPU's copy engine.
apply_channel_kernel as apply_channel and
superpose_kernel as superpose to fit the track. Bar
widths reflect the tdl-a profile measurement on RTX 5090: H2D ≈ 27 µs,
apply_channel_kernel + superpose_kernel ≈ 54 µs, D2H ≈ 14 µs
per stream (May 2026 perf-backend-compare run). The GPU's copy engines and compute
engine run concurrently, so one node's D2H and another's H2D coexist on the PCIe bus
while a third's kernel executes — total per-slot wall time stays around 120 µs even
with three nodes serving in parallel.Part V — Runtime mutability
The control plane: how channel parameters mutate at slot boundaries without restarting the broker.
17. Runtime mutability — the control plane
Parts I–IV describe a broker that reads its YAML once at startup and applies the same chain to every slot. This section is about the second way channel parameters can change: a live ZMQ control plane that mutates per-edge state at slot boundaries without restarting the broker. The data plane stays exactly as Part III describes it — the control plane meets it once per serve, through a lock-free snap at the top of the slot.
Three reasons this exists rather than relying on a YAML reload.
(1) Latency. Reload requires tearing down sockets and reallocating
device buffers; that's tens of milliseconds and a brief data outage, which is
unacceptable during a live UE attach.
(2) Atomicity. A reload changes every edge at once on whatever
slot the broker happens to be serving when the operator restarts; the control
plane lets the caller name a take_effect_at_slot so a mutation
lands at a known point in the UE's experience.
(3) Closed loop. A controller (RL agent, scripted scenario
driver) needs to observe what it just did before its next step; the
telemetry PUB feed publishes the post-snap state at a configurable rate so
the loop closes without polling REP.
17.1 Architecture — two planes that meet at the snap
Every edge gets a BrokerLinkControl on the broker side: a
shadow POD that the control thread writes, a live
POD that the data plane reads, and a per-edge atomic seqno
that publishes one to the other. The invariant is
single‑writer‑per‑link: only the
ControlServer thread (one per broker process) writes
shadow; only the per-destination server thread reads it via
snap_mutable_params() at the very top of every serve.
seqno is bumped by the writer with release semantics and
acquire-loaded by the reader; the snap on a steady-state slot is one
acquire-load + early-return.
When the snap detects a change, the data plane refreshes whatever
derived state the chain step needs. Scalar params (path_loss_db,
awgn_snr_db, cfo_hz) are read directly from
live in the per-sample chain — no refresh needed. Tap-0
and LOS params trigger refresh_tap0_from_live(); a profile
swap triggers refresh_all_taps_from_live(). On the CUDA path
both refreshes do a conditional D2H+rebuild+H2D round-trip on the dirty
edge, which is what preserves the device-owned cross-slot
delay_line (see §11.4). On the
CPU path the refresh rebuilds effective taps + polyphase from
live_profile in host memory. The shared
compute_windowed_sinc_taps is what keeps post-warmup CPU↔CUDA
parity bit-exact.
17.2 Wire protocol — one REP socket, five message types + telemetry PUB
The control plane is a single ZMQ REP socket bound at
tcp://*:5559 when the broker is launched with
--control-endpoint (omitted by default; the broker runs with
no control plane unless asked). All messages are JSON; the broker replies
to every REQ with {"ok":true, …} or
{"ok":false,"error":"…"}. Five message types cover the surface
(telemetry is a PUB frame, not a REQ — see the telemetry paragraph
below):
| Message type | Purpose | Key REQ fields | Key REP fields |
|---|---|---|---|
scalar |
Mutate one of seven runtime params on one edge (v1). | link_id, param, value, take_effect_at_slot?, batch_id? |
applied_at_slot |
profile_swap |
Replace the entire per-edge tap layout at runtime — up to
kDeviceMaxTaps = 32 taps plus an optional fading
sub-config (v2.0). |
link_id, taps[], fading?, take_effect_at_slot?, batch_id?, force? |
applied_at_slot, warmup_until_slot |
batch_begin |
Open a caller-keyed staging slot; subsequent
scalar / profile_swap REQs carrying the
matching batch_id stage instead of apply (v2.3). |
batch_id |
— |
batch_commit |
Flush every staged op with a single
take_effect_at_slot shared across every edge touched
(per-edge slot-index atomicity). |
batch_id, take_effect_at_slot? |
apply_at_slot, link_count |
batch_abort |
Discard the staged batch; no shadows touched, data plane unaffected. | batch_id |
dropped_ops |
Seven runtime-mutable scalar params (v1):
path_loss_db, awgn_snr_db, cfo_hz,
tap0_delay_samples (float — fractional supported),
tap0_gain_db, tap0_phase_rad, and
los_k_db. Validation failures (unknown link, unknown param,
out-of-range value, malformed JSON) reply with the typed error and emit
event=control_error; the data plane is unaffected.
Telemetry PUB feed (v3.0). A second optional socket bound at
tcp://*:5560 via --telemetry-endpoint publishes
one frame per edge per --telemetry-rate-hz tick (default
20 Hz). Each frame is a JSON event=telemetry body with
link_id, slot, seqno, live{…}, profile_active, warmup_until_slot;
the ZMQ topic prefix is link_id so a subscriber can filter
via setsockopt(ZMQ_SUBSCRIBE, "ue0-gnb0", …). Empty
subscription receives every edge. Backpressure is handled by ZMQ HWM;
slow subscribers cause telemetry_drops to accumulate rather
than blocking the broker.
Events the protocol emits. The complete event
vocabulary is documented in §19.1; the
control-plane subset, in the order it can appear:
control_start, control_update,
control_error, control_warmup_begin,
control_warmup_end, control_batch_begin,
control_batch_commit, control_batch_aborted,
telemetry, control_force_warning,
hardware_probe, hardware_footprint,
hardware_warning. The new counters this part introduces
(force_inert_warnings, batches_committed,
batches_aborted, telemetry_frames,
telemetry_drops) are summarised in
§19.2.
17.3 The warmup contract — the only non-meaningful samples
A profile_swap replaces the whole tap layout, which means
the cross-slot delay_line ring (see §11.4)
contains samples convolved against the previous profile. Continuing
to read from it would produce a transient that depends on history neither
the new profile nor the caller has any model of. The snap path resolves
this by zero-filling the ring on activation and emitting
event=control_warmup_begin slot=N link_id=L dl_samples=K
  warmup_slots=W
. Output samples produced during the next
warmup_slots are explicitly typed as warmup artefacts
— the first formal exception to the broker's "every emitted sample
is meaningful" contract. event=control_warmup_end fires when
the per-edge current_slot crosses the target; from that slot
onward CPU↔CUDA parity is restored bit-exact.
The profile_swap REP body carries
warmup_until_slot so the caller can plan around it. For any
production topology the default warmup is one slot
(count = 23 040 ≫ dl_size ≈ 128). Scalar updates
and tap-0 changes that don't alter layout skip warmup entirely.
--control-warmup-cap-slots REQ-time guard.
Profile swaps whose prospective warmup span exceeds the cap (default 3
slots) are rejected at REQ time with a typed error including the computed
span, dl_size, and slot count. The broker
publishes per-edge dl_size_samples_hint +
slot_count_hint at prepare time so the check happens without
round-tripping through the snap path. --control-warmup-cap-slots 0
disables the check; warmup span is still emitted via
event=control_warmup_begin.
17.4 The force flag — visibility on inert chains
A profile_swap is rejected by default on edges whose chain
doesn't start with tdl — the new profile would have
nowhere to land. force: true in the REQ overrides this: the
snap stores and activates the profile, but the per-sample chain has no
Tdl branch to read it, so kernel output is unchanged. The broker emits
event=control_force_warning link_id=L reason="chain has no leading
  tdl; profile stored but inert"
and bumps a per-edge
force_inert_warnings counter visible in
event=stop.
This is Option C from the v3 plan: explicit visibility without attempting either a silent dispatch-flip (Option B, rejected — surprising to the caller) or runtime chain synthesis (Option A, deferred until a real use case materialises). The data plane stays predictable; the warning is the broker's way of saying "this REQ succeeded but nobody is reading the result."
17.5 Hardware probe — the one part that runs without a control endpoint
At broker startup the CUDA backend runs
probe_cuda_hardware(device_id) and emits
event=hardware_probe ok=true device=N name="…" sm=Mm.M mem_bytes=B
  driver_version=V runtime_version=V
— a typed report of what
CUDA actually sees, separate from compile-time assumptions. CPU-only
builds skip the probe; CUDA builds without a visible device emit
ok=false + a typed error.
Two follow-on checks key off the probe.
Footprint: event=hardware_footprint estimated_bytes=B
total_mem_bytes=T reports the device-side memory the topology will
allocate; startup rejects with event=fatal when the estimate
exceeds 80% of totalGlobalMem — better to fail at
prepare than to OOM mid-serve.
SM (streaming multiprocessor) capability: if runtime SM is below the kernel's compile-time
target (OCUDU_GPU_CHANNEL_CUDA_ARCHITECTURES, surfaced via
kernel_target_sm()), the broker emits
event=hardware_warning and continues so the operator can
diagnose; --hardware-strict promotes the same condition to
event=fatal.
17.6 Validation status
The control plane has its own ctest suite,
ctest -R runtime_update_parity, currently 8/8 passing.
Coverage: per-param scalar mutability with CPU↔CUDA bit-exact parity at
1e‑3 tolerance on every deterministic param (AWGN is statistical at
the same Jakes tolerance); take_effect_at_slot deferred
apply; warmup begin/end emission; multi-link batch atomicity; force-flag
warning with counter bump; and link-key canonicalisation across the
CPU / CUDA prepare contracts.
On real hardware (RTX 5090, SM 12.0, CUDA 12.8.93) the locked
scripts/remote/gpu-test-sequence.sh 7/7 has passed end to
end with the Part V code paths exercised: the
refresh_all_taps_from_live D2H+H2D round-trip preserves the
device-owned delay_line; warmup zero-fill on the device path
matches the host reference; probe_cuda_hardware returns real
device values; the 80% footprint gate stays untriggered on the validation
topologies. The telemetry PUB feed compiles and dispatches under the
build gate but has not yet been exercised against a live subscriber.
Design plans for the three increments live alongside the source:
docs/plans/runtime-mutable-channel.md
(v1 scalars),
runtime-mutable-channel-v2.md
(v2 profile swap + timing + warmup + batches),
runtime-mutable-channel-v3.md
(v3 telemetry + force-flag + hardware probe). Each plan has a
locked-decisions section recording the user-approved design choices.
Part VI — Operations
What we test, what we measure, and how we read the numbers.
18. Validation
Three layers, each progressively closer to a live radio integration. The detailed test surface is mapped in §18.5 Diagram TA below.
Which layer is the testing target for what. The unit tests (§18.1) and the synthetic GPU validation (§18.2) are the targets for the internal build roadmap (the Phase 1/2/3 work — correctness, CPU↔CUDA parity, kernel behaviour); the live-radio integration smoke (§18.3) is the target for the Milestone A/B/C proof points (a real srsRAN gNB + srsUE completing attach + PDU (protocol data unit) session + ping through the broker). "Milestone" and "Phase" are two distinct axes — what works end-to-end vs how it was built — not competing labels.
18.1 Unit tests (ctest, 8/8)
Run with ctest --test-dir build --output-on-failure after
cmake --build. The suite (8 targets) groups as:
config— YAML schema validation: unknown keys, bad numerics, mixed sample rates, negative offsets, thetdltaps schema, fading config (f_d_max_hz, spectrum, LOS K-factor + angle), per-edgepropagation_delay_samplesand per-devicetx_timing_offset_samplescomposition,fold_link_leading_delaysequivalence.ring—IqRingpush/overflow, cursor-based read,discard_before, true wrap-around across the buffer boundary,reset()with new capacity.processing— the largest surface. Covers:- tdl behaviour (CPU): identity tap, 3-tap cross-slot impulse response, sinusoid passband at fractional delay.
- CPU↔CUDA bit-exact parity at 1e-3 tolerance: identity, integer + fractional delay, multi-tap cross-slot ring, fading (Jakes + LOS Rician composition).
- Dispatch-gate test — asserts
ProcessorTimings.used_device_channelistruefor a leading-tdl model andfalsefor a leading-non-tdl model, so a regression that silently reverts CUDA to host staging fails ctest. - Fading statistical guards: stationary (
f_d=0), bit-exact determinism (same seed → same floats across recompiles), strong-LOS magnitude (K = 40 dB), Bessel J0 autocorrelation match at three lags (tests/test_processing.cpp:1147), and Rician envelope PDF moments at K = 10 dB (tests/test_processing.cpp:1333). - Per-sample step behaviour (CPU standalone):
path_loss,phase,cfo,awgnin bothnoise_powerandsnr_dbmodes. - CUDA AWGN statistical — power + zero-mean + fresh draw per slot.
- tx_timing_offset + propagation_delay equivalence — fold composition tested on both CPU and CUDA.
broker— 2-device CPU loopback with all data-integrity counters at zero; 3-device fan-in/fan-out lockstep regression for the variable-size relay (documented dead-lock case).
18.2 Remote GPU test sequence (gpu-test-sequence.sh, 7/7)
The locked-in remote validation. Must pass before any change to the broker or CUDA backend ships. Each step adds a layer:
- CUDA release build (rsync local tree → build → check exit).
- ctest 8/8 on the remote box (same suite as §18.1 above, GPU
path enabled so all
OCUDU_GPU_CHANNEL_HAS_CUDAblocks actually run). - Synthetic CUDA relay loop — clean 0 dB channel, sink measures
avg_power ≈ 1.0. - Synthetic CUDA relay loop — AWGN
noise_power = 0.25, sink measuresavg_power ≈ 1.25within 0.003 %. - 3-node graph (Diagram G) —
gnb0RXavg_power ≈ 2.005(two UE uplinks summed),ue0/ue1RXavg_power ≈ 0.501(desired + −40 dB crosstalk). - 2-cell / 4-node / 8-link multi-gNB graph — all four nodes'
measured RX
≈ 0.262matches analytic superposition. - TDL-A profile — TR 38.901 §7.7.2 23-tap NLOS + Jakes 100 Hz on
every edge; bench p99 in the green band;
avg_power_cumwithin ±1.5 power units of the analytic expectation (the same tolerance the CPU↔CUDA matching test uses for single-realisation fading variance).
18.3 Live OCUDU + srsRAN smoke
Docker gNB + Open5GS core + srsUE through the CUDA broker, attach +
IP ping verification. Three variants exist on the remote box:
ocudu-attach-smoke.sh (1 gNB + 1 UE, Milestone A),
ocudu-multi-ue-smoke.sh (1 gNB + 2 UEs, Milestone B),
ocudu-multi-gnb-smoke.sh (2 gNBs + 2 UEs with ICI,
Milestone C). Detailed runbook at
docs/ocudu-interop.md.
18.4 Multi-port gates
Three of the standing gates exist specifically to judge multi-port behaviour, and they divide by what they can see:
- Synthetic, through the broker —
gpu-test-sequence.shsteps 8 and 9 relay a declared 2×2 correlated topology through a running broker and compare the received power against the analytic expectation (measured 9.542 against an expected 9.71, with an iid control at 6.964 against 6.94), then swap the correlation matrix on a live broker over the control plane and confirm the received power moves off the iid value. A milestone whose gates all call the processor directly proves the processor and nothing above it; these run the capability through the layer that ships it. - Live transport —
run-ocudu-mimo-2port-no-core.sh: a real 2-antenna OCUDU gNB at a pinned revision, a byte-pinned fixture, four ZMQ endpoints, no Docker and no core. It judges four-endpoint flow, sibling reply sizes, sibling acquisition skew, the gNB's own real-time failure count and the strict broker counters. - Live matrix —
verify-mimo-matrix-capture.py, run by the same gate against the broker's wire capture. This is the one that judges what the emulator computed: it reads H from the topology and compares y against Hx sample by sample, in both directions, reporting the off-diagonal share of each row. Numbers and mutation probes in §25.
A zero count satisfies every threshold. Each of these gates asserts that its instrument recorded work — samples compared, markers checked, kernels launched — before it asserts anything about the values. That rule was written after a benchmark reported millions of iterations and a kernel count of zero and exited green, and after this very gate reported marker_mismatches=0 beside marker_checks=0.
18.5 Test architecture — what each layer guards
19. Profiling — instrumentation system design
The broker is instrumented end-to-end so a real-time relay can be diagnosed from log lines alone, no debugger attach required. The instrumentation answers three questions: where is the time going, where are samples being lost, and where is the system at the edge of realtime margin.
The architecture has two producers emitting onto one stdout event stream, plus a parallel microbenchmark CLI that drives the same processor without ZMQ I/O:
- Host-side
chrono::steady_clockbrackets in the broker server loop — measure each per-serve stage (wait_req · align · read · process · throttle · send) and publish asevent=cpu_stage_timings. See Diagram K (§8) for the stage definitions. - CUDA event brackets around the processor's GPU work —
cudaEventRecordwraps H2D, kernel, D2H; the host reads the µs deltas aftercudaStreamSynchronizeand publishes them asevent=gpu_timings. The only layer that sees inside the GPU. - Microbenchmark CLI (
ocudu-gpu-channel-bench) — drives the channel processor in a tight loop with no ZMQ I/O and no broker scheduling, emitting per-percentile latency CSV. Shares the samecudaEventinstrumentation with the broker — just a different driving cadence. Numbers populate §20.
Both producers' events plus ring-pressure heartbeats, lifetime
data-integrity counters, and fatals share one stdout stream — see
§19.1 for the full vocabulary. Memory
footprint is analytical (computed at prepare() time, not
measured) — see §15.
chrono::steady_clock for host stages (align / read / pack /
throttle) and cudaEvent for the GPU phases (H2D / kernel /
D2H). Both µs streams emit as key=value lines on stdout in
the broker's vocabulary (§19.1). The
harness captures stdout to results/reports/ as CSV + JSON;
perf-sweep scripts aggregate per-config p50 / p95 / p99 and populate
the measurements in §20 + Diagram W. The bench reuses the same
processor + same cudaEvent primitives, so its numbers and
the live broker's numbers measure the same underlying work — only the
driving cadence differs.19.1 Event vocabulary
The broker emits six event kinds. Anyone reading broker.log can
watch in real time with grep -E 'event=(stop|fatal|gpu_timings|cpu_stage_timings)' broker.log;
the heartbeats are usually noise unless something has wedged.
| Event | Fields | Cadence | What it tells you |
|---|---|---|---|
event=cpu_stage_timings |
t, dev, wait_req_us, align_us, read_us, process_us, throttle_us, send_us |
1 Hz (last-serve snapshot) | Per-stage CPU latency of the broker's per-serve pipeline. process_us is the entire processor call (its h2d/kernel/d2h subset is in gpu_timings below). throttle_us is mostly idle wall-clock pacing. wait_req_us is idle waiting for the next REP request. |
event=gpu_timings |
t, h2d_us, kernel_us, d2h_us |
1 Hz (last-serve snapshot) | Per-phase GPU timings from cudaEventElapsedTime. Zero on the CPU backend. t is monotonic seconds since broker start. |
event=heartbeat |
t, dev, ring=size/cap, puller[state, pulls, idle, room_stall, last], server[state, serves, idle, data_spin, last] |
1 Hz, per device | Liveness probe and ring-pressure snapshot. room_stall climbing means the puller is blocked on a full ring; data_spin climbing means the server is starved. |
event=stats |
rx_requests, rx_starvations, tx_queue_overflows, tx_sequence_gaps, zmq_errors |
at --strict-realtime checkpoints |
Lifetime data-integrity counters. See §19.2 for what each surfaces. |
event=stop |
same fields as stats plus tx_pulls |
once, at shutdown | The final reckoning — what every smoke test greps for to verify the run. |
event=fatal |
error="…" |
at most once | Hard failure; broker exits non-zero. |
event=control_start |
endpoint="tcp://*:5559" |
once at startup, if --control-endpoint is set |
Confirms the runtime-control ZMQ REP socket is bound. Absent on runs without the flag. |
event=control_update |
link_id, param, old, new, seqno |
one line per applied runtime update | Phase 3 v1 mutable params. Reconstructs every accepted shadow write; the matching server-thread snap happens on the next slot boundary. seqno is per-edge monotonic. |
event=control_error |
reason="…" |
one line per rejected REQ | Validation failure (unknown link, unknown param, out of range, malformed JSON). The data plane is unaffected — the REP socket replies with {"ok":false,"error":"…"} and the broker keeps running. |
event=control_warmup_begin |
slot, link_id, dl_samples, warmup_slots |
at each profile_swap activation | Phase 3 v2.2: a profile_swap on this link zeroed the cross-slot delay_line. Output samples in the next warmup_slots are warmup artefacts; downstream analysis pipelines should skip this window. |
event=control_warmup_end |
slot, link_id |
at the slot crossing the warmup target | Pairs with the preceding warmup_begin for this link. Output from this slot onward matches the new profile bit-exact (CPU↔CUDA parity restored). |
event=control_batch_begin |
id |
one line per batch_begin REQ | Phase 3 v2.3: caller opened a staging slot. Subsequent scalar / profile_swap REQs carrying the matching batch_id stage into this slot instead of applying. |
event=control_batch_commit |
id, link_count, apply_at_slot |
one line per batch_commit REQ | All staged ops applied with a single take_effect_at_slot; per-edge slot-index atomicity (different links may tick at slightly different wall-clock times). |
event=control_batch_aborted |
id, dropped_ops |
one line per batch_abort REQ | Caller discarded the staged batch; no shadows touched. The data plane is unaffected. |
event=telemetry |
link_id, slot, seqno, live{…}, profile_active, warmup_until_slot |
per-edge, at --telemetry-rate-hz |
Phase 3 v3.0: published on the ZMQ PUB socket (--telemetry-endpoint). Topic prefix = link_id. Not written to stdout; subscribers filter via ZMQ_SUBSCRIBE. |
event=control_force_warning |
link_id, reason |
per snap of a profile_swap with force=true on a non-tdl-leading chain |
Phase 3 v3.1: the profile was stored + activated but the per-sample chain has no Tdl branch to read it. Data-plane output unchanged. Per-edge counter force_inert_warnings aggregates these into event=stop. |
event=hardware_probe |
ok, device, name, sm, mem_bytes, driver_version, runtime_version (or ok=false error="…") |
once at broker startup, when the CUDA backend is requested | Phase 3 v3.2: typed CUDA hardware report (probe_cuda_hardware → cudaGetDeviceProperties). On CPU-only builds the event is suppressed; on CUDA builds without a visible device the event reports ok=false + a typed error. |
event=hardware_footprint |
estimated_bytes, total_mem_bytes |
once at broker startup, after event=hardware_probe succeeds |
Phase 3 v3.2: best-effort estimate of the device-side memory the topology will allocate. Startup rejects with event=fatal when the estimate exceeds 80% of total_mem_bytes. |
event=hardware_warning |
reason="…" |
at startup if runtime SM < kernel target (without --hardware-strict) |
Phase 3 v3.2: kernel launches may fail; the broker keeps running so the operator can diagnose. With --hardware-strict the same condition becomes event=fatal. |
Both per-serve event types
(cpu_stage_timings, gpu_timings) publish the
last serve's numbers, not a rolling average — the emit happens on the
1 Hz heartbeat thread and just snapshots the worker threads' last-store
values. To get a percentile distribution, either pipe the broker log into a
rollup script or use the bench CLI which records every iteration.
19.2 Counter taxonomy
The data-integrity counters partition the failure modes a real-time emulator can hit. Each counter is a hard signal except for one:
rx_starvations— the server thread waited longer than 5×slot for an incoming edge to deliver new samples. Soft signal: non-zero in development on a noisy host is expected; non-zero under--strict-realtimemeans the host CPU is too slow for the configured sample rate × topology.tx_queue_overflows— the puller could not write a pulled batch into the device's ring (room stall exhausted retries). Indicates the broker is being fed faster than it can serve. Hard signal.tx_sequence_gaps— a server thread observed a cursor pointing beforeearliest_sequence(), meaning the ring discarded samples the cursor still pointed at. The cursor is snapped forward and the gap counted. Hard signal — IQ was lost.zmq_errors— non-recoverable ZMQ errno from any socket. Hard signal — transport broken.
20. Performance — measured boundaries
All numbers in this section come from runs on an
NVIDIA GeForce RTX 5090 (driver 570.211.01, 32 GB VRAM, CUDA 12.8.1)
via scripts/remote/perf-sweep.sh,
scripts/remote/perf-fanin-sweep.sh, and
scripts/remote/perf-backend-compare.sh. The bench
(ocudu-gpu-channel-bench) drives the same
ChannelProcessor::process_superposition() entry point the
live broker uses — one fused call per RX node per slot under CUDA, with
the CPU backend looping per edge internally and summing on the host. All
µs values are p99 over a 5–10 s run; verdict band per
§21.1 (slot deadline = 500 µs at 30 kHz SCS,
1 ms at 15 kHz SCS).
20.0 Phase 2 headline — TDL profiles realtime-fit
The Phase 2 device-channel pipeline moved the per-edge channel
(multi-tap convolution + Jakes Doppler + Rician LOS) from a host-side
loop into apply_channel_kernel on the GPU
(§11 Diagram S). For the first time, the
3GPP TR 38.901 TDL profiles fit inside the slot deadline by an
order of magnitude — and the CPU↔CUDA speedup grew from "10× on a
single-tap toy" to "30–46× on a realistic 23-tap fading channel".
Data below from
perf-backend-compare-2026-05-25 on the RTX 5090.
| Matrix | config | CPU p99 (µs) | CUDA mix p99 (µs) | CUDA kernel p99 (µs) | speedup | verdict @ 500 µs / 1 ms |
|---|---|---|---|---|---|---|
| Synthetic fan-in single-tap tdl + phase + cfo |
one-to-n_N1 | 627 | 121 | 13 | 5.2× | green / green |
one-to-n_N4 | 2269 | 191 | 15 | 11.9× | green / green | |
one-to-n_N16 | 8927 | 480 | 27 | 18.6× | yellow / green | |
| TR 38.901 TDL profiles 23-tap + Jakes 100 Hz LOS on D/E |
tdl-a (NLOS) | 7365 | 167 | 54 | 44× | green / green |
tdl-b (NLOS) | 7327 | 168 | 54 | 44× | green / green | |
tdl-c (NLOS) | 7781 | 168 | 56 | 46× | green / green | |
tdl-d (LOS K=13.3 dB) | 4643 | 152 | 41 | 30× | green / green | |
tdl-e (LOS K=22 dB) | 4468 | 157 | 43 | 28× | green / green |
Read in one line. Every TDL profile that was red on
CPU (4.5 – 7.8 ms per call, ≈ 10× the 500 µs / 30 kHz slot) is now
green on CUDA (152 – 168 µs, well under both 30 kHz and 15 kHz
deadlines). The per-edge channel kernel envelope is ~40–56 µs depending on
whether the tap set is LOS-bearing; H2D is the next cost at ~27 µs.
The bench's CPU↔CUDA avg_power_cum match within ±1.5 power
units per RX (statistical-equivalence guard at
perf-backend-compare.sh [7/7]) — i.e. CUDA isn't running a
different channel.
The headline tdl-a_E16 measurement called out elsewhere in this doc (1 gNB + 8 UEs, TDL-A 23-tap + Jakes 100 Hz on all 16 edges, 58 430 µs host → 319 µs device — 183×) is the same kernel under heavier fan-in. §20.4–§20.8 below use the older single-tap baseline data; treat those as the fan-in scaling reference rather than as the headline.
20.1 Multi-port cost — what a matrix channel adds
Measured on 4×RTX 5090 (driver 570.211.01, CUDA 12.8.93, sm_120), at 23.04 MS/s with a 23040-sample batch, CUDA backend, over a 3 s run, p99:
| Topology / chain | Kernel p99 | Note |
|---|---|---|
| 1×1, TDL-A 23-tap + Jakes 100 Hz | 53.599 µs | after the generator split; was 61.856 µs before |
| 16 edges, TDL-A 23-tap + Jakes 100 Hz | 69.536 µs | was 90.655 µs before |
| 2×2 spatial correlation, on top of the above | +4.2 µs | the mixing factor is computed once at load, not per slot |
The shape to take from that table: a physical link's cost scales with its lanes, because a lane is an ordinary edge to the kernel — a 2×2 is four edges, not a new kind of work — and the correlation mixing is a per-slot cost of a few microseconds because its LDLH factor is computed once when the topology loads.
On the live two-port gate (real OCUDU gNB, four ZMQ endpoints, 20 s, same rate and batch), the channel-processor call is sampled once per second by the broker's heartbeat: median 104.4 µs against the 1 ms slot of the fixture's 15 kHz SCS, with H2D / kernel / D2H medians of 36.8 / 12.9 / 27.4 µs. The observed maximum in those samples reaches ~1.4 ms; that tail is host scheduling and driver submit-or-sync rather than the channel path, it reproduces without the matrix, and the gate records it instead of scoring the host on it.
20.2 Methodology and test matrices
Two complementary test matrices are run. The baseline matrix
(5 configs) covers the topology shapes used elsewhere in the project; the
fan-in sweep (21 configs, generated by
scripts/gen_topology.py) isolates how a single RX node's
per-call cost scales with edge count, and exercises both fan-in axes of
the broker.
| Matrix | Config | Topology / shape | Edges | Busiest fan-in |
|---|---|---|---|---|
| Baseline (5) | mvp-2-edge | 1 gNB ↔ 1 UE — single bidirectional link | 2 | 1 |
multi-ue-4-edge | 1 gNB + 2 UEs, all pairs DL+UL | 4 | 2 | |
graph-6-edge | 3-node graph with UE↔UE crosstalk (Diagram G) | 6 | 2 | |
multi-gnb-8-edge | 2-cell 4-node multi-gNB with inter-cell interference | 8 | 2 | |
stress-16-edge | 9-node fan-in star: one sink with 8 incoming + 8 outgoing | 16 | 8 | |
| Fan-in sweep (21) | Set 1: 1-to-N | 1 gNB ↔ N UEs, no UE↔UE crosstalk | 2 N | N (gNB) |
| Set 2: M-to-N | M gNB ↔ N UE bipartite, no inter-gNB / inter-UE crosstalk | 2·M·N | max(M, N) |
Set 1 sweeps N ∈ {1, 2, 4, 8, 16, 32, 64} with M = 1 (7 configs). Set 2 sweeps the symmetric points (M = N) ∈ {2, 4, 8, 16} plus 10 asymmetric pairs for a total of 14 configs.
What the bench measures vs what the broker does. The
bench is single-threaded and runs every RX node's
process_superposition() call sequentially within one
iteration, then loops. Its p99 therefore reflects the
worst single call across the topology — usually the device with
the largest incoming-edge count. The live broker, by contrast, dispatches
per-node calls on independent CUDA streams (Diagram I) that overlap on
the GPU and overlap with ZMQ I/O on the host. The bench is a per-call
cost ceiling; the broker's per-slot wall-clock cost is always ≤ the
bench's worst call. §20.7 demonstrates this empirically.
API-unification note: the bench's earlier
--mode per-edge flag drove a now-removed
process_into() entry point — see §2 and §14 for the full
context. Only process_superposition() exists today; a
single-edge call is just
process_superposition(dst, {edge}, nullptr, …).
20.3 CPU vs CUDA — the baseline matrix + fan-in sweep
Two views of the same comparison. The baseline matrix (left) runs
five named topologies that recur elsewhere in the project; the fan-in
sweep (right) isolates how a single RX node's per-call cost scales as
the edge count grows from 1 to 64. Both use the unified
process_superposition path; CUDA is one fused launch per node
per slot, CPU loops per edge and sums on the host. Speedup widens
monotonically with edge count.
Baseline matrix — five named topologies
| config | backend | p99 µs | h2d p99 | kernel p99 | d2h p99 | verdict | speedup |
|---|---|---|---|---|---|---|---|
mvp-2-edge | CPU | 295.1 | — | — | — | yellow | 1.0× |
| CUDA | 64.6 | 26.3 | 4.8 | 17.7 | green | 4.6× | |
multi-ue-4-edge | CPU | 793.0 | — | — | — | red | 1.0× |
| CUDA | 107.3 | 40.3 | 6.1 | 19.7 | green | 7.4× | |
graph-6-edge | CPU | 832.7 | — | — | — | red | 1.0× |
| CUDA | 92.5 | 40.9 | 6.9 | 19.7 | green | 9.0× | |
multi-gnb-8-edge | CPU | 696.8 | — | — | — | red | 1.0× |
| CUDA | 99.7 | 41.3 | 5.8 | 20.7 | green | 7.0× | |
stress-16-edge | CPU | 2236.3 | — | — | — | red | 1.0× |
| CUDA | 226.7 | 118.8 | 10.3 | 17.7 | yellow | 9.9× |
Fan-in sweep — synthetic 1-to-N (single RX node receiving from N TX sources)
Topology generator (scripts/gen_topology.py one-to-n N)
built configs from N = 1 to N = 64. CPU column populated from
perf-backend-compare (May 25 2026) at N ∈ {1, 4, 16}; CUDA
column at every N ∈ {1, 2, 4, 8, 16, 32, 64} from the post-D4
perf-fanin-sweep. Verdict band at the 500 µs / 30 kHz slot.
| N (edges) | CPU p99 µs | CPU verdict | CUDA p99 µs | CUDA h2d p99 | CUDA kernel p99 | CUDA d2h p99 | CUDA verdict | speedup |
|---|---|---|---|---|---|---|---|---|
| 1 | 627 | red | 121.0 | 28.7 | 13.0 | 19.7 | green | 5.2× |
| 2 | — | — | 138.0 | 38.9 | 13.0 | 21.0 | green | — |
| 4 | 2269 | red | 191.5 | 68.9 | 15.1 | 20.9 | yellow | 11.9× |
| 8 | — | — | 283.2 | 121.0 | 18.8 | 21.0 | yellow | — |
| 16 | 8927 | red | 478.7 | 228.4 | 28.5 | 21.1 | yellow | 18.6× |
| 32 | — | — | 866.4 | 445.2 | 43.4 | 21.1 | red | — |
| 64 | — | — | 1676.7 | 886.0 | 73.9 | 21.1 | red | — |
Read this in one line. CPU is red the moment N reaches 4 and grows roughly linearly with N (~140 µs per edge). CUDA stays green through N = 2, yellow through N = 16, and crosses red at N = 32 because H2D — not the kernel — saturates the PCIe (PCI Express) 5.0 x4 link (§20.6, Diagram W). The kernel itself only grows from 13 µs at N = 1 to 74 µs at N = 64 — the channel work scales but stays well within budget; the bottleneck is the link, not the math. Speedup widens from 5.2× at N = 1 to 18.6× at N = 16, the highest CPU-measured point. At N = 32 and N = 64 the CPU is too slow to measure cleanly in a 5 s run; the CUDA-only rows are still useful as the fan-in scaling reference even though the speedup column is unfilled.
process_superposition path. CPU crosses the 500 µs
slot deadline at 4+ edges. CUDA stays in green through 8 edges and yellow
at 16. The CPU/CUDA speedup widens with edge count — from 4.6× at the
single-edge config to 9.9× at the 16-edge stress topology — because the
CUDA path fuses all edges into one launch while CPU loops linearly.20.4 Where the latency goes — per-phase breakdown
The CUDA per-call cost decomposes into three components that scale differently with edge count:
- H2D dominates and scales linearly with N — staged buffer is N × 23 040 × 8 B; transfer time grows ~1:1 with edge count (26 µs at N=1 → 119 µs at N=8 → 884 µs at N=64). At large N it saturates the PCIe link (§20.6).
- Kernel grows sub-linearly — one fused launch per RX node;
each thread loops N incoming edges in registers. The reported
kernel_usp99 grows 5 µs → 11 µs → 54 µs as N goes 1 → 8 → 64, but most of that is queueing behind the H2D — actual kernel runtime measured by nsys is 1.7 µs median at N=8 (see §20.5). - D2H is a fixed floor ≈ 19 µs — the output is one batch regardless of N.
- CPU backend grows linearly with incoming-edge count
(295 → 800 → 700 → 2 240 µs as N goes 2 → 4 → 8 → 16). Bounded by
the per-sample chain loop — CFO's
sin/cos, gain/phase multiplies, AWGN's Philox draw if present. Saturates realtime at ~2 edges per RX. Reference path only.
Diagram T quantifies all three phases against N out to 64. The N=4 config is the last green point (p99 = 135 µs); N=16 is the last yellow point (425 µs, just under the 500 µs slot); N=32 is the first red (810 µs).
20.5 Compute & memory utilisation — the GPU is half idle
A deep profile run on the stress-16 config (16-edge fan-in at one sink)
measures what's actually limiting the GPU. Captured via
scripts/remote/perf-deep-profile.sh with
nvidia-smi dmon sampled at 1 Hz alongside
nsys profile for kernel-level tracing.
Memory footprint — measured vs. analytical
| Where | Idle | During stress-16 bench | Postrun | Notes |
|---|---|---|---|---|
| GPU VRAM (32 607 MiB total) | 547 MiB | 1 061 MiB | 547 MiB | Bench's device allocation = 514 MiB. Postrun returns to idle — clean teardown. |
| Host RSS (bench process) | — | 122 MiB | — | Includes pinned host_staged, host_output, plus bench scratch + libzmq + libcuda. |
Compared to the analytical estimate in §15:
the stress-16 sink alone needs ~1.4 MiB staged host + 1.4 MiB device +
180 KiB output = under 3 MiB per node. With 9 nodes preallocated by
prepare(), the live working set is well under 30 MiB. The
rest of the 514 MiB device alloc is CUDA runtime context, libcudart
arenas, and pinned-host mirror buffers — overhead, not signal.
Capacity is never close to a constraint at any realistic scale.
Parallel resource utilisation — compute headroom
| Metric | Value during stress-16 bench | Source |
|---|---|---|
| SM utilisation (median) | 56 % | nvidia-smi dmon -s u |
| Memory subsystem utilisation | 0 % | nvidia-smi dmon -s u — kernel doesn't stress GDDR7 |
| Graphics clock (active boost) | 2 392 MHz | nvidia-smi --query-gpu=clocks.current.graphics |
| Memory clock | 13 801 MHz (full GDDR7 boost) | nvidia-smi |
| Power draw (active) | 54 W (vs 575 W TDP — 9 %) | nvidia-smi --query-gpu=power.draw |
superpose_kernel actual GPU runtime | 1.7 µs median, 2.3 µs avg, 7.6 µs max (30 309 launches over 3 s) | nsys cuda_gpu_kern_sum |
cudaMemcpyAsync avg call overhead | 1.5 µs (host side) | nsys cuda_api_sum |
cudaLaunchKernel avg call overhead | 2.2 µs (host side) | nsys cuda_api_sum |
cudaStreamSynchronize avg wait | 45 µs (waiting for the GPU pipeline to drain) | nsys cuda_api_sum |
Compute is wildly underused on this kernel. SMs sit at 56 %, GDDR7 is untouched, power draw is 9 % of TDP, graphics clock is at boost. The kernel runs in 1.7 µs and uses ~720 warps (23 040 threads / 32) — fits on 6 of the 170 SMs at 100 % occupancy, leaving 164 SMs idle per launch. Host API overhead is small too (~9 µs/call). The bottleneck is everywhere except the GPU.
ncu (Nsight Compute) per-kernel deep metrics
(SM throughput, warp-issue rate, achieved occupancy) require setting
NVreg_RestrictProfilingToAdminUsers=0 or running with root —
not available on the measurement workstation. The numbers above come from
nsys profile + nvidia-smi dmon, which work
unprivileged.
20.6 The PCIe bottleneck — host↔device link is the wall
Hardware finding: the link negotiated as gen 5 x4, not x16,
on this workstation. The RTX 5090 silicon supports x16 (sysfs
max_link_width = 16), so the cap is the slot's electrical
routing or BIOS bifurcation. This cuts the theoretical ceiling 4× from
what an RTX 5090 could otherwise do.
D4 source rebuffering (landed) is dormant on current
production topologies. The mechanism is in place — H2D payload
scales with unique source count instead of edge count, indexed
per edge via DeviceLinkState::src_index — and the new
ctest (2 edges from gnb0 to ue0 through
different models) verifies the dedup is correct. But the byte-level
win only materializes when multiple edges within one destination's
incoming set share a source (i.e. multiple edges exist for the same
(from, to) pair, e.g. a desired-path edge plus a
crosstalk-model edge). Every current production topology — including
every TDL profile, the one-to-N fan-in, the multi-gNB graph, and
stress-16 — has at most one edge per (from, to) pair, so
num_sources == link_count at every destination and D4
saves zero H2D bytes. The post-D4 perf-fanin-sweep
re-measured H2D at one-to-n_N8 at 121.0 µs vs the
pre-D4 119.4 µs — within run-to-run noise, confirming the
topologies tested here don't benefit. D4 is a correct future-proofing
step for multi-model-per-pair topologies that haven't shipped yet.
| Direction | Bytes / call | Bench p99 µs | Achieved Gbps (p99) | Ceiling (gen 5 x4) | Utilisation |
|---|---|---|---|---|---|
| H2D (raw IQ, N = 8) | 1.40 MiB (8 unique sources × 23 040 × 8 B) | 121.0 | 97.5 | ≈ 126 Gbps | 77 % |
| D2H (RX output) | 180 KiB (23 040 × 8 B) | 21.0 | 70.2 | ≈ 126 Gbps | 56 % |
Both rows are one-to-n_N8 from the post-D4
perf-fanin-sweep on commit d3b1a15. H2D is at
77 % because each process_superposition call issues
three H2D memcpys (device_source_iq, device_steps,
device_step_meta); the two small ones don't amortise.
Diagram W traces the saturation curve across the full 1-to-N sweep.
The pre-D4 N = 8 H2D was 119.4 µs / 98.7 Gbps — within run-to-run
noise of the post-D4 numbers above, as expected since one-to-N has
one link per (from, to) pair and D4's per-source dedup
has nothing to merge here. On a gen 5 x16 link the ceiling would
jump to ~504 Gbps, and the H2D phase at stress-16 would drop to
~30 µs — pulling even N = 32 well under the slot.
perf-fanin-sweep.sh, May 25 2026, on the
d3b1a15 build). At N = 1 the per-call transfer is 180 KiB
and the link is launch-latency-bound (51 Gbps achieved). As N grows the
payload grows linearly (180 KiB × N) and from N = 8 onwards achieved
bandwidth asymptotes at ~107 Gbps ≈ 85 % of the 126 Gbps PCIe 5.0 x4
effective ceiling. Per-byte cost flattens; doubling N doubles H2D µs
almost exactly. A gen 5 x16 link would lift the ceiling to ~504 Gbps and
unlock another ~2× of headroom; the current workstation is capped here.
(See the §20.6 prose above for why D4 source-rebuffering doesn't shift
this curve on the one-to-N topology.)20.7 What the bench measures — and what it can't
§20.2 noted that the bench is single-threaded and runs each RX node's
process_superposition call sequentially, so its
p99 is the cost of the worst single call rather than
the per-slot wall-clock. The 21-config fan-in sweep proves this
empirically: every (M, N) configuration collapses onto the
max(M, N) curve.
process_superposition call — which is the device with the
largest fan-in (a gNB with N incoming UL, or a UE with M incoming DL).
This is a property of the bench, not the broker. The live broker
dispatches per-node calls on parallel CUDA streams (Diagram I) which
overlaps the work across the GPU; the per-slot wall-clock cost is
≤ max(M, N) + small overlap residual, not (M + N).The bench is therefore an upper bound on the live broker's per-slot cost. Confirmed indirectly by the OCUDU smoke run on the 8-edge topology, where the broker measured h2d ≈ 22 µs · kernel ≈ 5 µs · d2h ≈ 14 µs per slot — better than the bench's 41 / 6 / 20, because the broker isn't oversubscribing the GPU and gets idle time from the throttle between slots.
20.8 Boundary synthesis on RTX 5090
Pulling everything together — what's realtime, what isn't, and where the wall is:
- CPU realtime ceiling: ≈ 2 incoming edges per RX node at 23.04 MS/s with this model chain (yellow at 2 edges, red beyond). Reference path only — never the production target.
- CUDA bench ceiling (this workstation, gen 5 x4):
N ≈ 16 incoming edges at one RX node is the last yellow
point (p99 = 425 µs). At N = 32 the H2D phase alone exceeds the
slot. The bench p99 also collapses to
max(M, N)for M-N topologies (Diagram U), so the same boundary applies to every Set 2 config. - CUDA broker ceiling (estimated): the live broker dispatches per-node calls on parallel CUDA streams (Diagram I) and overlaps them with the throttle's idle time. The OCUDU smoke run at 8 edges measured h2d ≈ 22 µs · kernel ≈ 5 µs · d2h ≈ 14 µs per slot in the broker, vs. the bench's 41 / 6 / 20 — confirming the broker isn't oversubscribing the GPU. Extrapolating, the broker on this hardware should handle ~32 incoming edges per RX node before H2D saturation hits.
- What hits the wall first: H2D copy latency, growing ~15 µs per staged-buffer edge under the x4 link. Kernel stays ≤ 15 µs even at N = 64 (per-thread inner loop only). D2H is a fixed ~19 µs floor. Compute is wildly underused (56 % SM, 9 % power — see §20.5).
- Memory is never the constraint — busiest config uses ~3 MiB per RX node in live working set; total bench footprint under 30 MiB. The 514 MiB device alloc is mostly CUDA runtime context overhead (§20.5).
- What unlocks more headroom: (a) a gen 5 x16 link — 4× the H2D ceiling, lifts the bench boundary from N ≈ 16 to N ≈ 64 (the GPU has the compute for it, the link is the only thing in the way). (b) H2D pipelining (split staged buffer + ping-pong copy) — overlaps copy with the previous slot's kernel; listed in §26 planned work for single-mega-node topologies if such a workload becomes interesting. (c) Heavier per-edge chains — adds compute work that the GPU has lots of headroom for, doesn't grow PCIe traffic.
21. Operational guidance
- Use
--strict-realtimefor CI and any merge gate — it turns starvation, overflow, and continuity events into hard exit-non-zero failures. - Reading the latency gate: green = p99 added latency ≤ 25 % of the NR slot;
yellow = stable, ≤ one slot; red = > one slot or unstable. Yellow on the
benchmark + zero
rx_starvationsin a relay loop is normally enough for development; ship green. - Sample rates other than 23.04 MS/s work as long as the topology declares
them consistently. The slot batch defaults to
auto(= 1 ms worth of samples). - If
rx_starvationsclimbs in production: usually the host CPU is slower than the sample-rate cadence on whichever node started missing deadlines. Check the kernel timings first (event=gpu_timings); the GPU is rarely the bottleneck. - Distributed IQ across machines over Wi-Fi or VPN is not viable — see
docs/distributed.md. Co-locate the broker and radios on a wired LAN, ideally the same host.
21.1 Latency-gate verdict
The bench CLI publishes a green / yellow / red verdict alongside the
p99 latency, defined formally as:
| Band | Condition | Meaning |
|---|---|---|
| green | p99 added latency ≤ 25 % of the slot | Plenty of margin — the slot deadline is met even with reasonable jitter. |
| yellow | p99 added latency ≤ one slot | Stable but tight — a brief OS scheduling hiccup can blow the deadline. |
| red | p99 added latency > one slot | Cannot keep up with realtime — bench reports red, broker would report sustained rx_starvations. |
The bench's latency is in-memory model mixing only; ZMQ I/O, broker scheduling, and host↔device contention are not in it. The broker itself measures the full pipeline. Both rows are reported in the performance section so the gap is visible.
21.2 Containerised deployment
The repo ships a multi-stage Dockerfile at the root that
packages the broker and the companion CLIs
(ocudu-gpu-channel-bench, ocudu-zmq-source,
ocudu-zmq-sink) and bakes the example topologies into the
image at /opt/ocudu/examples. The runtime is well-suited to
containerisation: it has no hardcoded host paths and is entirely
CLI-driven (--config, --control-endpoint,
--telemetry-endpoint, …), so the only host coupling is the
GPU and the ZMQ sockets.
Two-stage image. A build stage on
nvidia/cuda:<ver>-devel installs
cmake pkg-config libzmq3-dev and compiles everything
(apps + the eight ctest targets); a slim runtime stage on
nvidia/cuda:<ver>-runtime carries only
libzmq5, the four binaries, and the examples, running as a
non-root ocudu user. Prerequisite for GPU access is the NVIDIA
Container Toolkit on the host — the image ships the CUDA runtime libraries,
the host provides the driver.
| Build arg | Default | Why it exists (portability) |
|---|---|---|
CUDA_ARCH |
80-real;86-real;89-real;90-real;120-real;80-virtual |
Multi-arch by default: native SASS for Ampere → Blackwell plus
PTX from compute_80, so any GPU ≥ 8.0 not in the list JIT-compiles at
first launch. Override to a single arch (e.g.
90-real) for a smaller, faster build. |
CUDA_VER |
12.8.1 |
Selects the CUDA base image. The host driver must support this
runtime version; lower it to match an older driver, and drop
120-real since Blackwell needs CUDA ≥ 12.8. |
ENABLE_CUDA |
ON |
Set OFF (with DEVEL_BASE /
RUNTIME_BASE pointed at ubuntu:24.04) for a
GPU-less image on hosts without an NVIDIA GPU — CI, macOS, AMD,
laptops. The CPU backend is always built. |
Run contract. On a Linux host, host networking matches what the
live srsRAN gNB already expects (tcp://host.docker.internal):
docker build -t ocudu-gpu-channel:latest .
docker run --rm --gpus all --network host ocudu-gpu-channel:latest \
  --config /opt/ocudu/examples/topology.mvp.cuda.yaml --duration 15s
On non-host networking (Docker Desktop), publish the control
plane with -p 5559:5559 -p 5560:5560 plus the per-node data
endpoints instead. Real-time caveat: prefer --cpuset-cpus
CPU pinning over a --cpus quota — a CFS quota can inject
scheduling stalls the broker surfaces as rx_starvations.
Testing in the container. Because docker build has no
GPU access, the CUDA-gated tests (hardware_probe,
runtime_update_parity, broker) cannot run in a
build-time layer; they run post-build against the build target
with a GPU attached:
docker build --target build -t ocudu-gpu-channel:build .
docker run --rm --gpus all --entrypoint bash ocudu-gpu-channel:build \
  -c 'cd /src/build && ctest --output-on-failure'   # 8/8 on RTX 5090
The multi-arch list is compiled for every target but only
arch 120 (the RTX 5090) is hardware-validated; the other arches
are built but unverified for lack of the hardware.
Part VII — Multi-port radios and the matrix channel
How a radio with several antenna ports is declared, why its ports share one sample epoch, how the Nt×Nr matrix is applied, and what the live evidence does and does not claim.
22. Radio nodes — a radio is not its socket
Everything before this part describes a graph whose vertices are ZMQ endpoint pairs. That is exactly right for a single-antenna radio and exactly wrong for a radio with two. A 2T2R OCUDU gNB opens four ZMQ sockets, and the four are not four radios: they carry one PHY's sample stream, split across ports. This part is the overlay that says so.
The vocabulary gains one level. A port is what §4 called a node — a ZMQ
endpoint pair, its TX ring, and its puller. A radio node owns one or more ports and
everything with timing in it: the sample epoch, the source cursors, the single channel
call, the throttle, and the output rows. A physical link is the directed pair of
radio nodes; a lane is one (rx_port, tx_port) coefficient
inside it. A physical link between an Nt-port transmitter and an
Nr-port receiver expands to Nt × Nr
lanes, and each lane is an ordinary edge of the engine described in Parts III–IV.
There is no second channel engine for MIMO: process_superposition() takes
Nr output rows instead of one, and a single-port topology is the
Nt = Nr = 1 case of the same path.
Ports are grouped in YAML under radio_nodes:, and writing order is the
matrix index. There is no suffix parsing and no sorting: the first entry of
tx_ports is column 0 of H, the first entry of
rx_ports is row 0. Links then name nodes rather than ports.
radio_nodes:
  - id: gnb0
    tx_ports: [gnb0_p0, gnb0_p1]     # column 0, column 1
    rx_ports: [gnb0_p0, gnb0_p1]     # row 0, row 1
  - id: ue0
    tx_ports: [ue0_p0, ue0_p1]
    rx_ports: [ue0_p0, ue0_p1]

links:
  - from: gnb0                        # a link connects RADIOS, not sockets
    to: ue0
    model: dl_2x2
Three properties of that schema are load-time rules rather than conventions:
- Declaration is all-or-nothing. A topology that declares some radios and leaves others implicit is rejected. Partial declaration would leave the remaining matrix indices decided by parse order rather than by the author.
- A port belongs to one node, in one role at most. A port that is a TX port and not an RX port simply gets no REP worker, because a REP worker on a port the producer never writes does not error — it waits forever on an empty ring, which is a silent hang.
- Siblings must agree on sample rate, TX timing offset and receiver model. These are properties of a radio, and a per-port disagreement is a topology that cannot mean what it says.
Omitting radio_nodes: entirely is still valid and still means what it
always meant: every device lowers to an implicit single-port radio, and the resulting
link_key keeps its pre-MIMO form with no lane suffix. That
exception lives in one function, so "a 1×1 topology is byte-identical to before" is a
property of the code rather than of a promise.
Where the resolution is recorded. The broker prints what it resolved, in matrix order, at startup: event=radio_node_resolved id=gnb0 tx[0]=gnb0_p0 tx[1]=gnb0_p1 rx[0]=gnb0_p0 rx[1]=gnb0_p1 implicit=false. Port order is the one thing a reader cannot check from a coefficient table, so it is logged rather than inferred.
23. One sample epoch per radio
A matrix channel is a statement about simultaneity: every coefficient of H relates signals from one instant. Two sockets that advance independently do not describe a matrix channel no matter how correct the arithmetic is. This section is how the broker makes that unrepresentable rather than merely unlikely.
The per-slot data path splits into three thread roles, nodes + 2 × ports in total:
- A puller per port drains its peer's TX into that port's ring. Unchanged from Parts III–IV.
- A producer per radio node chooses the serve window once, reads every incoming lane at that window, calls the channel exactly once, advances every source cursor by the same count in one loop, paces to the node sample rate, and pushes each output row into its RX port's ring.
- A REP worker per port owns only the socket state machine: receive a request, pop one window, reply. It selects nothing.
The window choice moving out of the request-driven thread is the whole point. In the single-antenna design each destination's server thread picked its own window at its own instant; with two such threads owning the two rows of one radio, they could pick different counts and drift apart permanently. With one producer per node there is no second thread that could pick a different window, so sibling ports consuming different sample ranges is not a state the design can reach.
That guarantee has to survive the last hop to the wire. The producer publishes a window to every sibling ring in one loop; the REP workers then answer with exactly one such window, taken from a queue of boundaries the producer wrote under the same lock as the samples. Sizing a reply the obvious way instead — min(batch, available) — reads ring occupancy, and two sibling threads sample that at two different instants, so a producer push landing between them splits one common window into two differently-sized replies. That is not a hypothetical: it happened, at a rate of 4 groups in 23 483, and it is what the two-port test peer's sibling_size_mismatches counter exists to see.
Nothing zero-fills. An empty ring means the REP worker holds the request until real processed IQ exists, exactly as the single-antenna server did, which is also how OCUDU's own gNB TX behaves when its buffer is empty.
23.1 The broker is the radio's clock, and must not run fast
A ZMQ radio has no clock of its own. It advances only as fast as the broker exchanges samples with it, which makes the broker its time base — and a time base that runs fast is not a harmless inefficiency on a multi-port radio. It is a deadlock, and the mechanism is worth stating because it is invisible from our side of the socket:
- OCUDU's ZMQ RX channel pushes each received message into a fixed circular buffer and, when that buffer is full, retries in place with a 1 µs sleep (radio_zmq_rx_channel.cpp).
- That retry runs on the single radio worker thread that serves every TX and RX channel of the session (worker_manager.cpp, create_prio_worker → single_worker).
- The RX stream pops its ports in sequence. So one full port captures the thread its starved sibling needs, the PHY blocks on the sibling, and the full port is never drained.
On a single-port radio that same loop is self-clearing back pressure — the PHY keeps popping the one buffer being pushed. From two ports up it is a hard deadlock, in both directions at once, at 0% CPU. The emulator must therefore never hand a radio samples faster than its nominal rate, and "never" includes recovering from its own idle time: a pacer that sleeps until anchor + produced/rate is not a rate limiter while it is behind. Every second the producer spent blocked waiting for the radio to start requesting becomes a second's worth of slots it is owed, and it emits them back to back. The pacer therefore drops lateness beyond one batch rather than spending it (include/ocudu_gpu_channel/pacing.h). Under-feeding is safe — a lock-step radio simply waits — and over-feeding is not.
24. The matrix channel — fixed, correlated, and coherent LOS
Three ways to say what H is, in increasing order of physical content. All three expand to lanes and run on the per-edge kernel of §11 without a MIMO-specific code path.
24.1 fixed_mimo — a deterministic matrix
A dense complex matrix, declared coefficient by coefficient, folded at load time into each lane's leading tap gain and phase. A tap already carries a·ejφ, so this needs no runtime field and no backend change. Two consequences are worth knowing before writing one:
- A unit coefficient adds exactly 0 dB and 0 rad, so identity and permutation matrices are bit-exact.
- A coefficient that is absent is zero, and is not generated at all. Decibels cannot express an exact zero, so a zero lane is dropped rather than attenuated — which is both exactly zero and cheaper. Sparse means what it reads as: an omitted lane is 0, not 1, and there is no implicit 1/√Nt normalisation anywhere.
models:
  dl_2x2:
    fixed_mimo:
      coefficients:
        - { tap: 0, rx: 0, tx: 0, real: 0.80, imag:  0.10 }
        - { tap: 0, rx: 0, tx: 1, real: 0.25, imag: -0.15 }
        - { tap: 0, rx: 1, tx: 0, real: -0.20, imag: 0.30 }
        - { tap: 0, rx: 1, tx: 1, real: 0.90, imag: -0.05 }
    chain:
      - type: tdl
        taps: [{ delay_samples: 0.0, gain_db: 0.0, phase_rad: 0.0 }]
24.2 Stochastic lanes — independent realizations of one channel
With a fading tdl chain and no matrix declared, each lane is an independent
realization: the lanes of one physical link are Nt×Nr
independent draws of the same channel. Two ownership rules make that reproducible and
physically coherent:
- Seeds are derived arithmetically, not from strings. A physical link seed feeds lane_fading_seed(link_seed, r, t, step). Renaming a key or editing a matrix does not re-roll the channel, and the mixing function is written out rather than taken from std::hash, so reproducibility survives a change of standard library.
- Absolute time belongs to the physical link, not the lane. A lane cannot hold a clock — the field was deleted from the fading state and the fading routine takes time as an argument instead of advancing it. All Nt×Nr lanes of a link therefore share one time origin by construction, which is the second half of "one channel realization".
24.3 spatial_correlation and los_matrix
Independent lanes are the iid case. A Kronecker declaration E[h hH] = Rrx ⊗ Rtx mixes the lanes' generators through an LDLH factor computed once at load, and the same routine decides positive semidefiniteness and produces the factor — a matrix the loader would refuse cannot enter through the runtime path either. Only upper-triangle entries are accepted, which makes a non-Hermitian or non-unit-diagonal matrix unrepresentable rather than merely rejected.
    spatial_correlation:
      kind: kronecker          # or: iid
      rx: [{ i: 0, j: 1, re: 0.7, im: 0.0 }]
      tx: [{ i: 0, j: 1, re: 0.4, im: 0.0 }]
los_matrix: gives the Rician specular its phase relationship across lanes,
replacing a per-lane random draw — a coherent LOS component is what makes a
line-of-sight MIMO channel rank-deficient, so drawing its phase per lane was quietly wrong.
Undeclared means all-ones (rank-1, phase 0 everywhere); declared means fully declared,
because a partially specified LOS matrix has no defensible completion. Note the deliberate
asymmetry with fixed_mimo, where an absent entry means zero: the
two knobs look alike and their missing-entry semantics are opposites, which is why they
have not been merged.
Rejections are part of the interface.
fixed_mimo alongside a non-iid correlation is refused (two
declarations of the same thing); so is kind: full (deferred, and
the parser says so by name), a correlated link above the 16-lane cap, and a correlation
block on a chain that does not lead with a fading tdl. At runtime,
tap-scope updates and profile swaps are refused on a fixed_mimo
link, because that link's matrix is its tap weights.
24.4 On the GPU — rows are a grid axis
Lane expansion needed no new kernel. apply_channel_kernel was already
per-edge parallel on grid.y, so four lanes of a 2×2 are four
edges. Superposition gained the second dimension:
grid.y = Nr with a row_begin[] index, so
row r sums exactly the lanes in
[row_begin[r], row_begin[r+1]). That interval is only well-formed
because lanes are stably sorted by (destination node, rx_port)
when the topology is resolved — and the same stability fixes floating-point summation
order, which is what makes the CPU↔CUDA parity contract of §14 hold on multi-port
topologies. The receiver model is applied per row with its own state, so sibling rows never
share a CFO phase accumulator or an AWGN counter.
One resolver, three consumers. The broker, the CPU backend and the
CUDA backend all used to walk config.links and derive lanes independently.
Three independent derivations of the same lane set will eventually disagree, and the
disagreement is silent — the relay keeps emitting IQ, it just stops being the
y = Hx the topology describes. The lane set, lane order and
per-lane state keys are computed once by resolve_topology() and the three
consumers read it.
25. Live evidence, and the line it stops at
What has actually been run against a real radio, and what that does not license anyone to claim.
The standing live gate is a real 2-antenna OCUDU gNB (four ZMQ endpoints, pinned revision, byte-pinned fixture) exchanging IQ with the CUDA broker and a two-port synthetic peer, with no Docker and no 5G core. Over a 20 s run it holds ~1 174 four-endpoint groups per second with every strict broker counter at zero, zero Real-time failure in RF in the gNB's own log, sibling reply sizes identical, and sibling TX acquisition skew of 0 samples.
Those are transport facts. On their own they would also be satisfied by a broker that passed each port straight through, so the gate additionally judges what the emulator computed. The broker records a bounded window of both wires per port — what it pulled off the peer's TX and what it replied with on its own RX, at the socket boundary — and an independent checker reads H from the topology YAML, recomputes yr = Σt H[r][t] xt, and compares:
| Measured on the live gate | Downlink (real gNB signal) | Uplink (marked peer signal) |
|---|---|---|
| max |y − Hx|, row 0 / row 1 | 4.1e−08 / 2.6e−08 | 1.5e−07 / 1.2e−07 |
| tolerance | 1e−04 (the fixed_mimo dB/rad round trip costs ~1e−07) | |
| share of row amplitude from the other transmit port | 0.12 / 0.768 | 0.331 / 0.508 |
| analytic marker mismatches, 230 400 samples/port | — | 0 |
The last two rows are the ones that carry the MIMO claim. The off-diagonal share makes "each received row depends on both transmit ports" a measurement rather than an assertion: a relay running two independent 1×1 lanes scores zero there. The marker check compares the captured uplink columns against a closed form of (port, ordinal), which pins the common sample epoch — sibling columns read from different origins fail it even when the matrix arithmetic on them is self-consistent.
Three mutation probes confirm the check fails when it should: a diagonal matrix fails all four rows (0.052–0.284); one lane removed fails row 1 in both directions while row 0 still matches at 1e−07, so detection is localised to the removed lane; and skewing one sibling column's epoch by a single sample fails all four rows while the markers still pass.
The claim boundary, stated as plainly as the code states it. The gate's own report carries transport_only: true, ue_decode: false, rank2_claim: false. A live rank>1 link needs a UE PHY that jointly estimates and decodes a matrix channel, and the srsUE build this project integrates does not: its NR receiver reads antenna 0 only (ue_dl_nr.c passes sf_symbols[0] to PDCCH, PDSCH and CSI-RS estimation). Several independent single-port UE processes are not one multi-port UE. Multi-port transport flow is not a rank-2 claim, and this project does not make one. What is live-demonstrable today is a 2-port gNB whose ports the emulator combines through a declared matrix, and an uplink the gNB equalises across both of its receive ports.
Part VIII — Scope
What's in today, what's planned, and the conditions that gate planned work.
26. Scope and planned work
Closing section. Parts I–VII (§1–§25) covered what the project does today, end-to-end; this section names what it deliberately does not yet do, and what is queued. Items are grouped by category and prioritised — operational flexibility first (planned but not blocked on workload demand), performance frontier next (only relevant if a future topology saturates the current envelope), topology shapes last (lower priority — out of scope unless the use case appears).
Scope today
- CUDA is the target backend; CPU is the correctness reference and local development path. Both are bit-exact for the supported step set.
- Supported chain steps: tdl, path_loss, phase, CFO, AWGN.
tdlis the chain-leading propagation step (covers scalar gain via a single tap atdelay_samples = 0, single-tap integer or fractional sample delay, and full multi-tap multipath with the same step). The earliergain,integer_delay, andfractional_delaystep types were subsumed bytdlin Phase 1.3 and no longer exist in the schema.tdlalso carries an optionalfading:sub-config (Phase 1.4): per-edge fd,max, per-tap Jakes sum-of-sinusoids, optional per-tap Rician LOS specular. Gaussian / Flat spectra are reserved in the schema but not yet implemented. - Per-edge delay knobs that fold into a chain-leading
tdlat config-load time:device.tx_timing_offset_samples(per source) andlink.propagation_delay_samples(per edge). The composed offset shifts every existing tap'sdelay_samplesif the chain already leads with atdl; otherwise a single-taptdlwith the offset is prepended. See §9. - Single processor entry point:
ChannelProcessor::process_superposition()handles single-edge and N-edge fan-in uniformly. The previousprocess_into()API was unified away in this branch (it was the N=1, rx_model=nullptr case of superposition). - Multi-port radios and the matrix channel are in. Ports group
into radio nodes under
radio_nodes:, a link between two such radios carries an Nt×Nr matrix, and the matrix can be deterministic (fixed_mimo), stochastic with independent lanes, or spatially correlated with a coherent LOS component (spatial_correlation,los_matrix). All of it expands to per-edge lanes on the existing kernel; a single-port topology stays byte-identical. See Part VII. - Live rank > 1 is NOT in, and is not claimed. Multi-port IQ flow through the emulator is transport evidence; a rank-2 claim needs a UE PHY that jointly estimates and decodes a matrix channel, which the integrated srsUE does not do (§25). Several single-port UE processes are not one multi-port UE.
- Antenna-array geometry, beamforming, precoder selection and TR 38.901 CDL are out of scope. The matrix here is declared or drawn, not synthesised from a geometry.
- Broker is a standalone external process, not a patch into OCUDU or srsRAN.
- Scale claims depend on topology, sample rate, model chain, and hardware — measured per topology (§20), not promised.
The realistic channel-model surface (TR 38.901 TDL profiles, Jakes spectrum, Rician LOS composition) is documented in the channel-physics section earlier in the doc. This section restricts itself to scope statements (what is and isn't implemented) and planned work.
Done — operational flexibility
- Runtime-mutable channel parameters — v1 scalars, v2 profile swap +
timing + warmup + batches, v3 telemetry + force-flag + hardware probe
(Phase 3, all landed). The full control plane is documented as a
coherent feature in §17: the
shadow → snap pattern (§17.1),
the six-message wire protocol with telemetry PUB
(§17.2), the
profile_swapwarmup contract (§17.3), the force-flag inertness warning (§17.4), and the CUDA hardware probe + 80% footprint gate +--hardware-strict(§17.5). Validation status — ctestruntime_update_parity8/8 plus the GPU-workstation confirmation thatrefresh_all_taps_from_liveand the warmup zero-fill work on real silicon — is recorded in §17.6.
Planned — operational flexibility
- Mixed-sample-rate edges via per-edge resampling. Today the
validator rejects topologies where source and destination
sample_rate_hzdiffer. A small per-edge polyphase resampler at the broker would let asymmetric stacks (e.g., a 23.04 MS/s gNB and a 30.72 MS/s probe) talk through the same emulator. Compute cost is bounded; the bigger work is the variable batch-size accounting along the path.
Planned — performance frontier (only if we hit the wall)
The actual hardware fix for the PCIe bottleneck is a true gen-5 x16
slot (§20.6). The software levers below are
worth pursuing only if the hardware can't change; listed in priority
order. Post Phase 2 D3 + D4: the channel runs on the GPU; H2D
bytes per slot are indexed via DeviceLinkState::src_index
so they scale with source count when multiple edges of a destination
share a source. The host stage_link() cost that was
the dominant per-call latency is gone for any all-leading-tdl
topology. The per-edge PCIe duplication is gone in principle, but
doesn't reduce bytes in current production topologies because each
(from, to) pair has at most one edge (see §20.6).
The remaining frontier work is now smaller per-µs trims. See
docs/plans/device-channel-pipeline.md for the measured
pre / post numbers.
D7 (source ring on GPU) — still parked. D4 took the biggest win in this neighbourhood (H2D bytes proportional to source count, not edge count) without breaking the CPU↔GPU bit-exact parity invariant. D7 would push further by keeping the ring itself on the GPU, but it costs the parity invariant + destination-decoupling guarantee. Trigger conditions for revisiting are unchanged (plan doc D7 section).
- CUDA Graphs — capture-and-replay the per-slot pipeline.
The H2D + kernel + D2H sequence is static after
prepare(): same kernel, same memcpys, same chain layout. Recording it once as acudaGraphand replaying viacudaGraphLauncheach slot eliminates ~10 µs/call of host-side dispatch overhead (cudaLaunchKernel+ fourcudaEventRecords + threecudaMemcpyAsyncs, totals in §20.5). Biggest impact at small N where the 10 µs is a large fraction of total per-call cost; at N = 1 (mvp-2-edge), that's 10 / 65 µs ≈ 15 % gain. Cheap to prototype, no kernel changes. - Coalesced H2D per call. Each
process_superpositioncurrently issues three H2D memcpys (device_staged,device_steps,device_step_meta); packing them into one contiguous transfer saves the two extra PCIe transaction setups (~3–5 µs each). Expected savings: ~20 % faster at N = 1, ~6 % at N = 8, < 1 % at N = 64 — the staged buffer dominates absolutely at high N, so this helps small configs proportionally more. - Mixed precision (cf16 IQ). Today IQ is two float32s (8 B/sample). Going to cf16 halves the staged buffer, halves H2D / D2H bytes per slot, doubles the effective PCIe bandwidth. At N = 8 it would compress H2D from 119 µs → ~60 µs — equivalent to upgrading from x4 to x8 PCIe without touching hardware. The only software lever that lifts the bench ceiling. Cost: revisiting the bit-exact CPU↔CUDA contract (AWGN sigma in fp16 needs care; gain / phase / CFO multiplies are fine). Highest impact item by far — only one that actually scales the boundary.
- H2D pipelining (ping-pong staged buffers) — re-elevated by
Phase 2 D3. Originally deprioritised because the pre-Phase-2
kernel:H2D ratio was ~1:10 (kernel ~54 µs vs H2D ~884 µs at
N=64 with cuda_mvp). Phase 2 D3 changed that for TDL profiles:
on
tdl-a_E16the kernel is now 97 µs vs H2D 121 µs — a ~1:1.3 ratio. Ping-pong (two staged-buffer pairs alternating across consecutive serves) would now mask roughly the kernel time per slot — ~30 % of total. Doubles staged-buffer VRAM (still ~6 MB per node — trivial). The "heavier kernel pushes kernel µs into the same order as H2D µs" trigger condition has fired.
Planned — topology shapes (lower priority)
- Distributed IQ across hosts. Today the broker and radios must be co-located (docs/distributed.md). A second broker hop over RDMA-class networking would let the emulator scale across nodes. Out of scope for now — the per-edge latency budget on a wired LAN is already tight; over IP fabric it's almost certainly impossible at slot cadence.
ocudu-gpu-channel · GPU-accelerated real-time channel emulator for live srsRAN and OCUDU stacks · broker in src/broker.cpp · kernels in src/cuda_backend.cu
Leading Contributor: Zhouyou Gu, SUTD
Contributors: MinwooEun — rank-1 MISO/SIMO
(details)
Released under the MIT License · © 2026 Zhouyou Gu